


{{item.videoDuration}}
{{item.title}}
{{item.text}}

{{item.videoDuration}}
{{item.text}}
What does this mean for your organisation?

New climate change projections for New Zealand have been released by the National Institute of Water and Atmospheric Research (NIWA) and Ministry for the Environment (MfE). These projections provide valuable information for organisations to understand the impacts of climate change. In this article, we explore what’s changed and provide some examples of how the data can be used.
What’s changed?
Funded by MBIE, NIWA along with MfE and its Climate Data Initiative, have downscaled the latest generation of global climate models to zoom in on New Zealand. This means as a nation we can get more granular on climate change projections. The data includes variables related to temperature, rainfall, wind, and more.
The projections are based on newer climate models that simulate more up-to-date emissions pathways, known as SSPs. A table below compares the two datasets side-by-side. Compared to the previous dataset, the new projections include additional variables and due to the NetCDF format the data has been shared in, offer more detailed geospatial analysis.
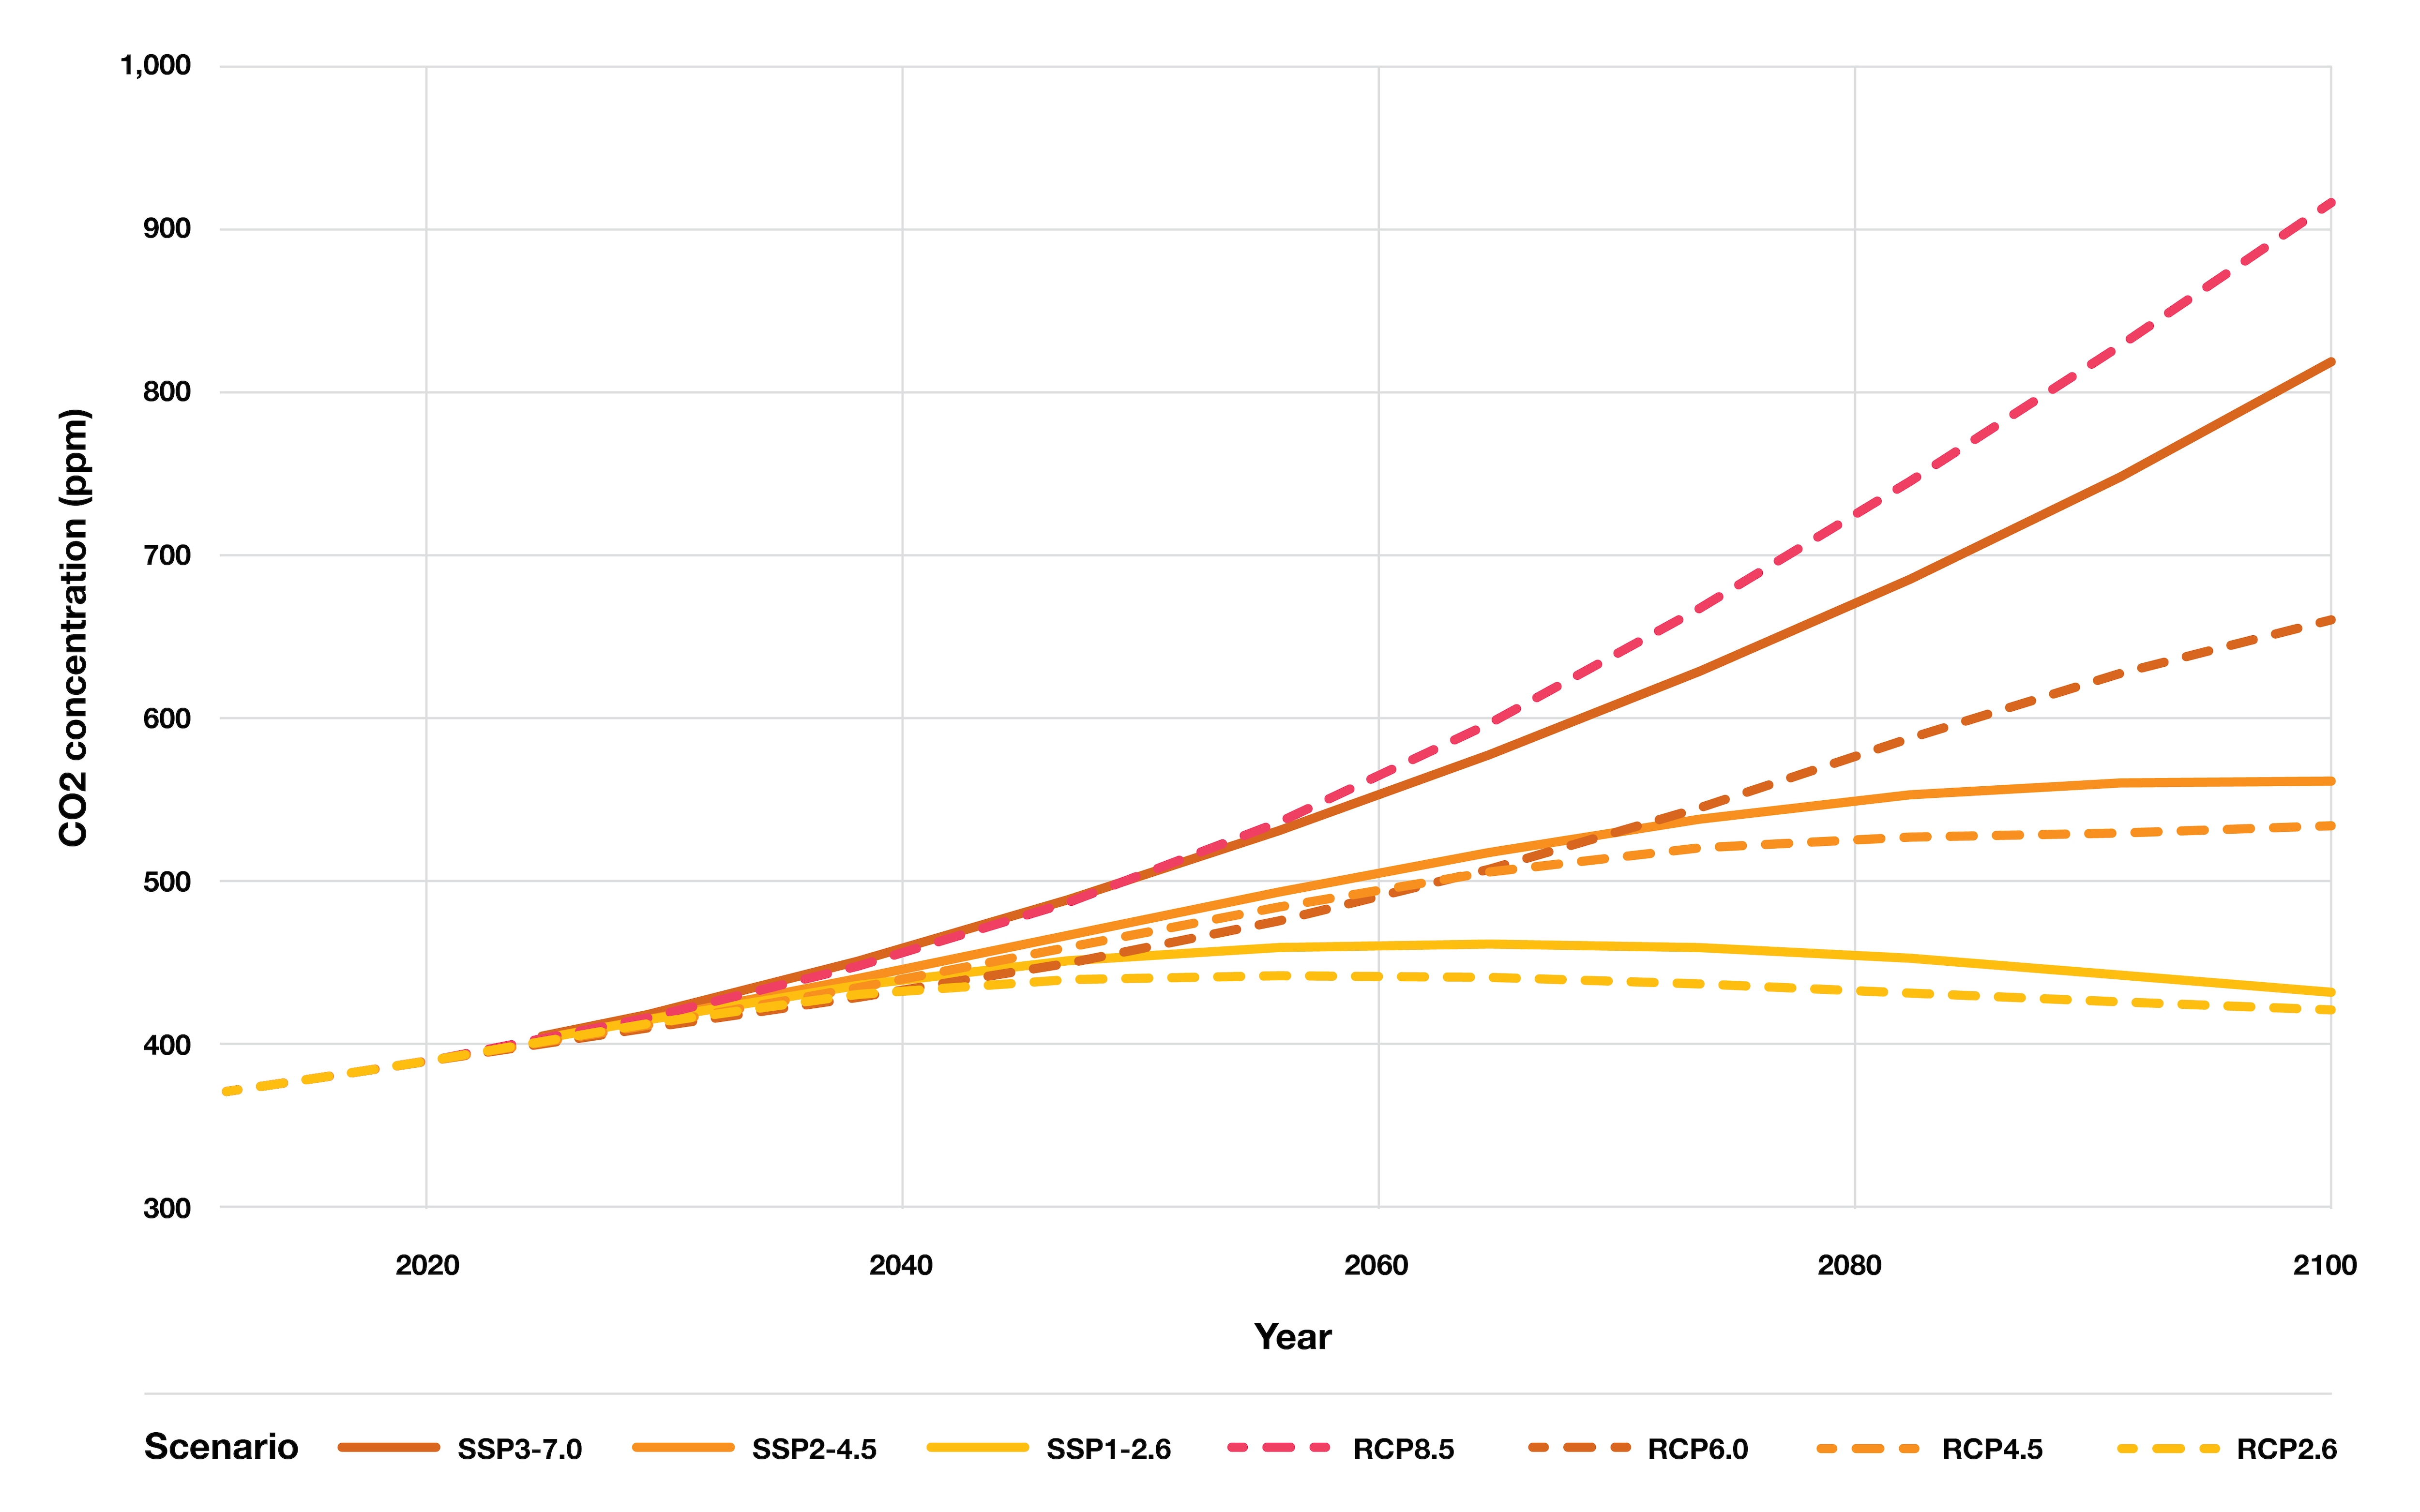
The graph below shows the three new CO2 concentration pathways (solid lines) against the four previous concentration pathways (dashed lines).
The table below shows the comparison of features between the previous and updated downscaled climate data projections.
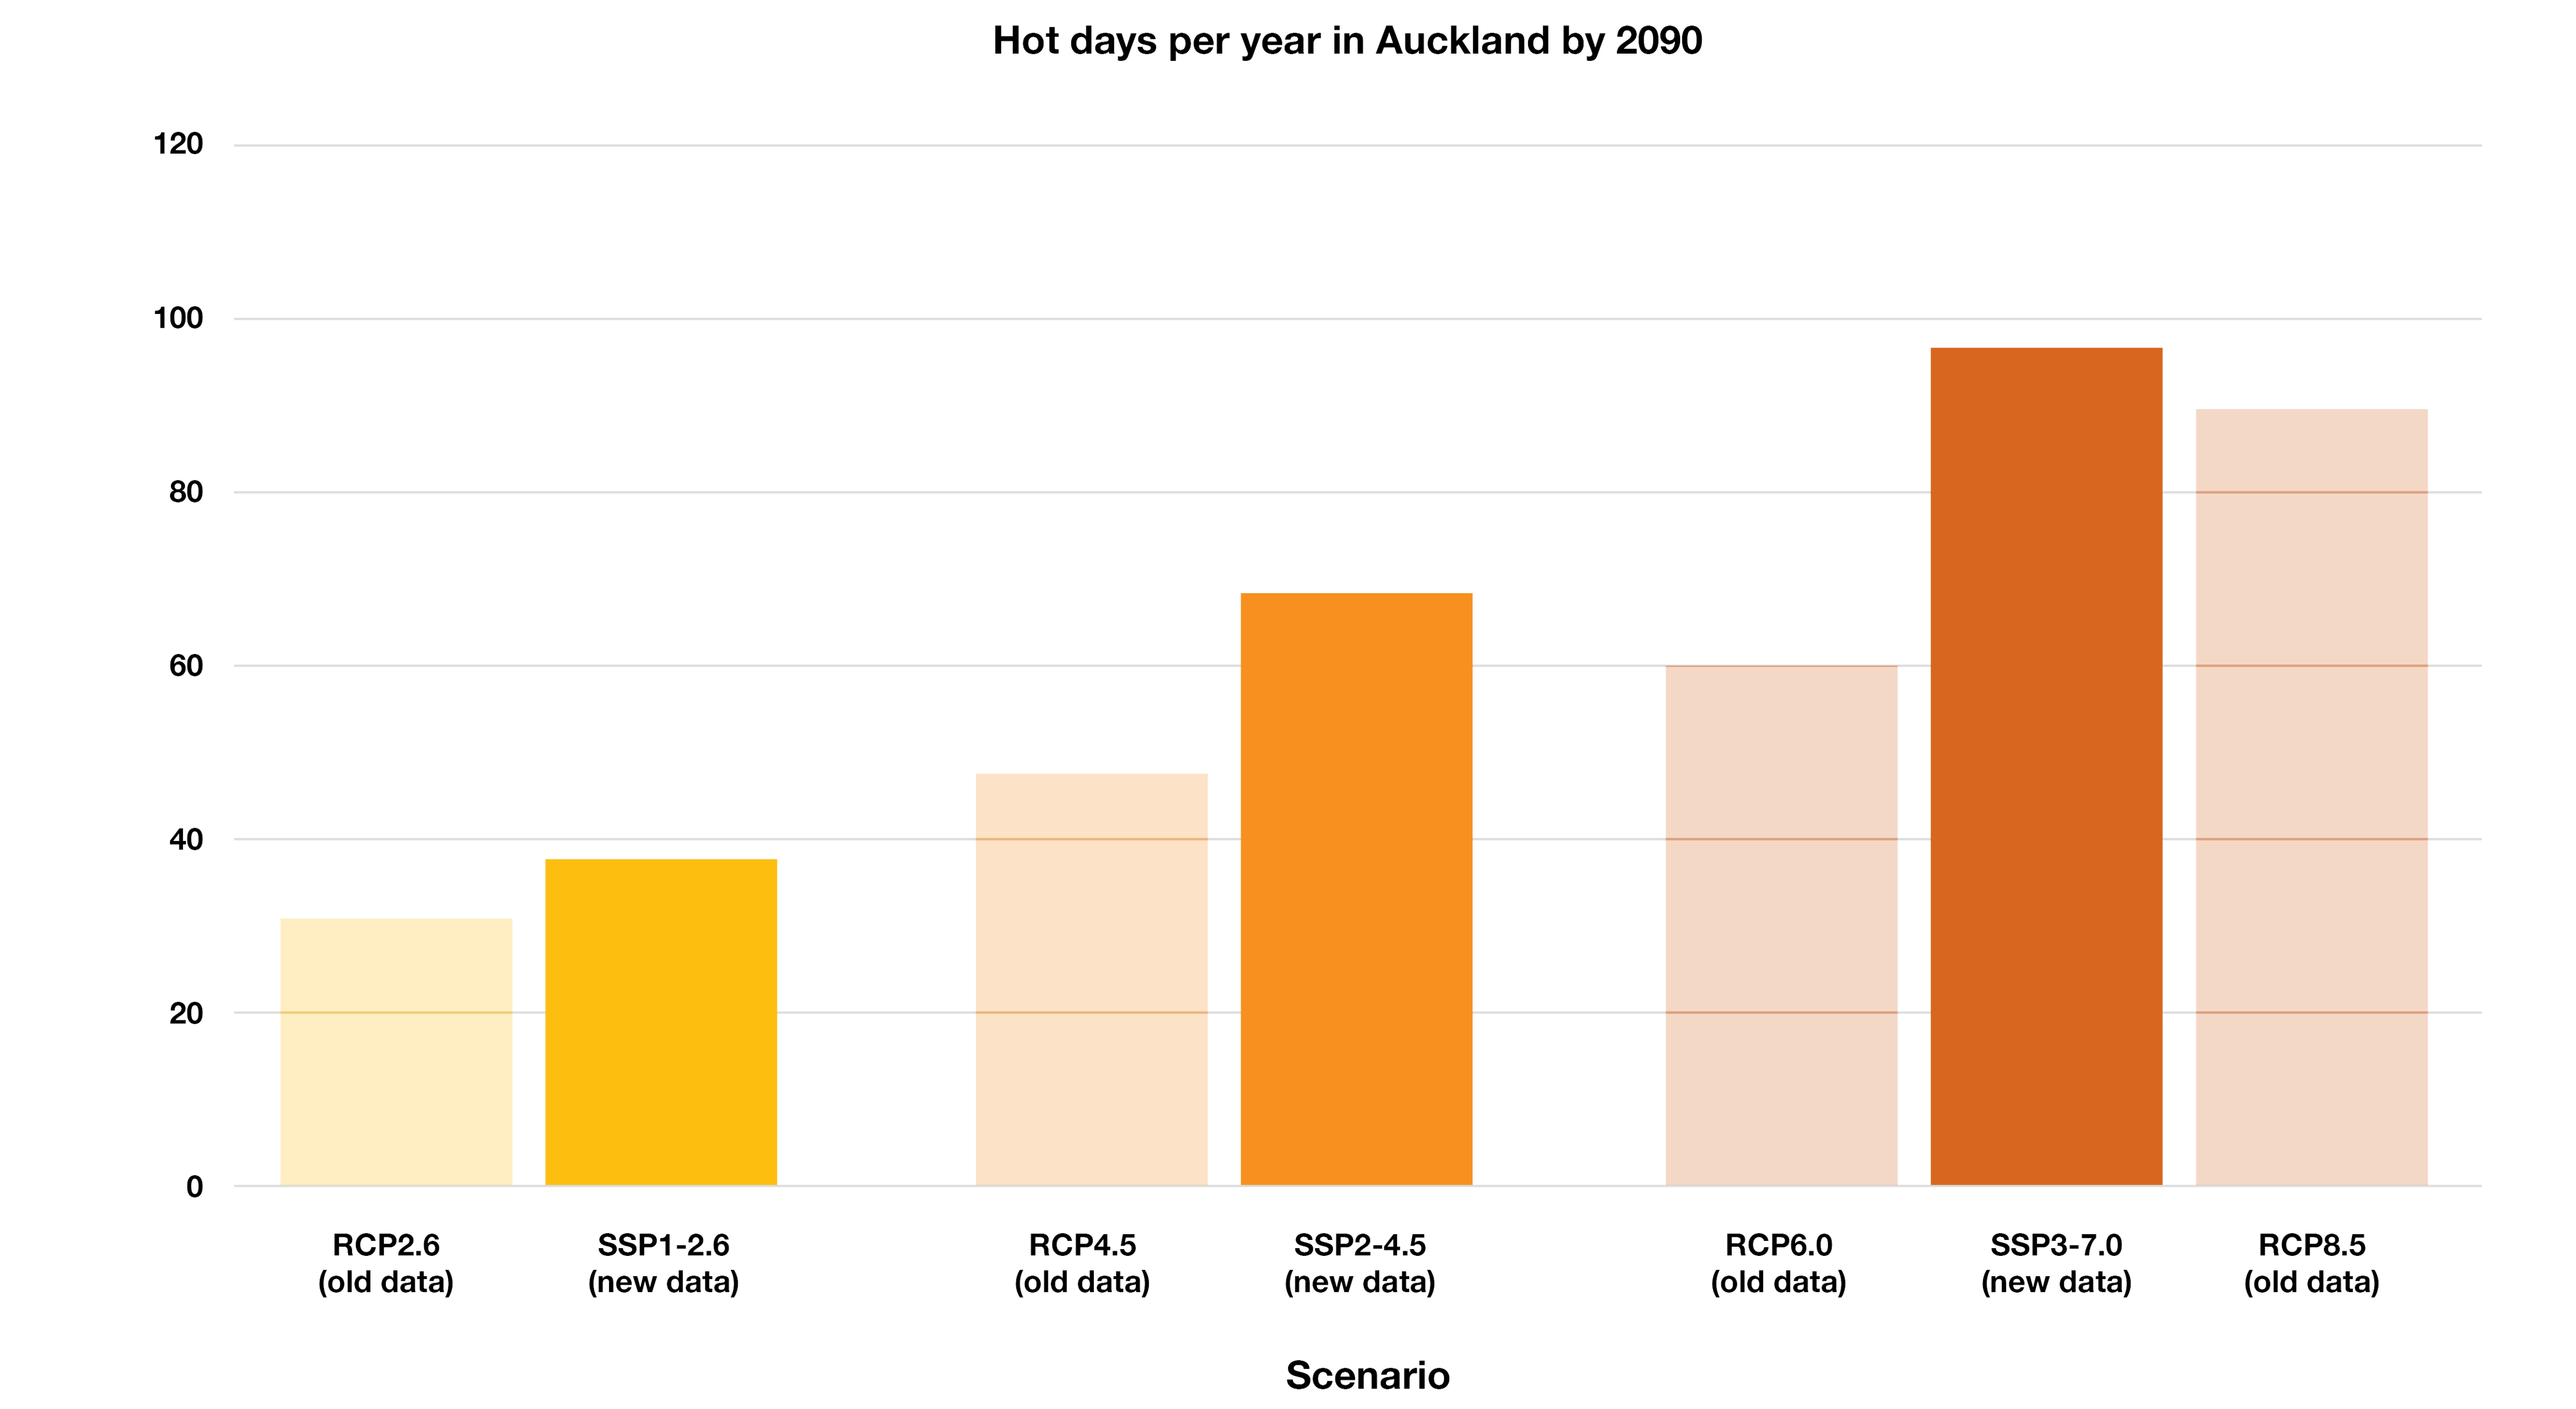
While there are no major surprises, there are some changes in key variables at the regional and seasonal levels. For example, Auckland will experience more hot days over 25°C than previously thought, and changes to springtime rainfall are projected to be more pronounced than they were previously - drier in the east and north and wetter in the southwest.
The overall conclusions haven’t changed dramatically: New Zealand will face warmer temperatures, more intense rainfall, more hot days, fewer frost days, and longer dry spells for some regions. The exact implications depend on where you’re located and the type of activities you undertake.
An example of how the updated data changes our understanding of climate impacts, using hot days over 25°C in Auckland.
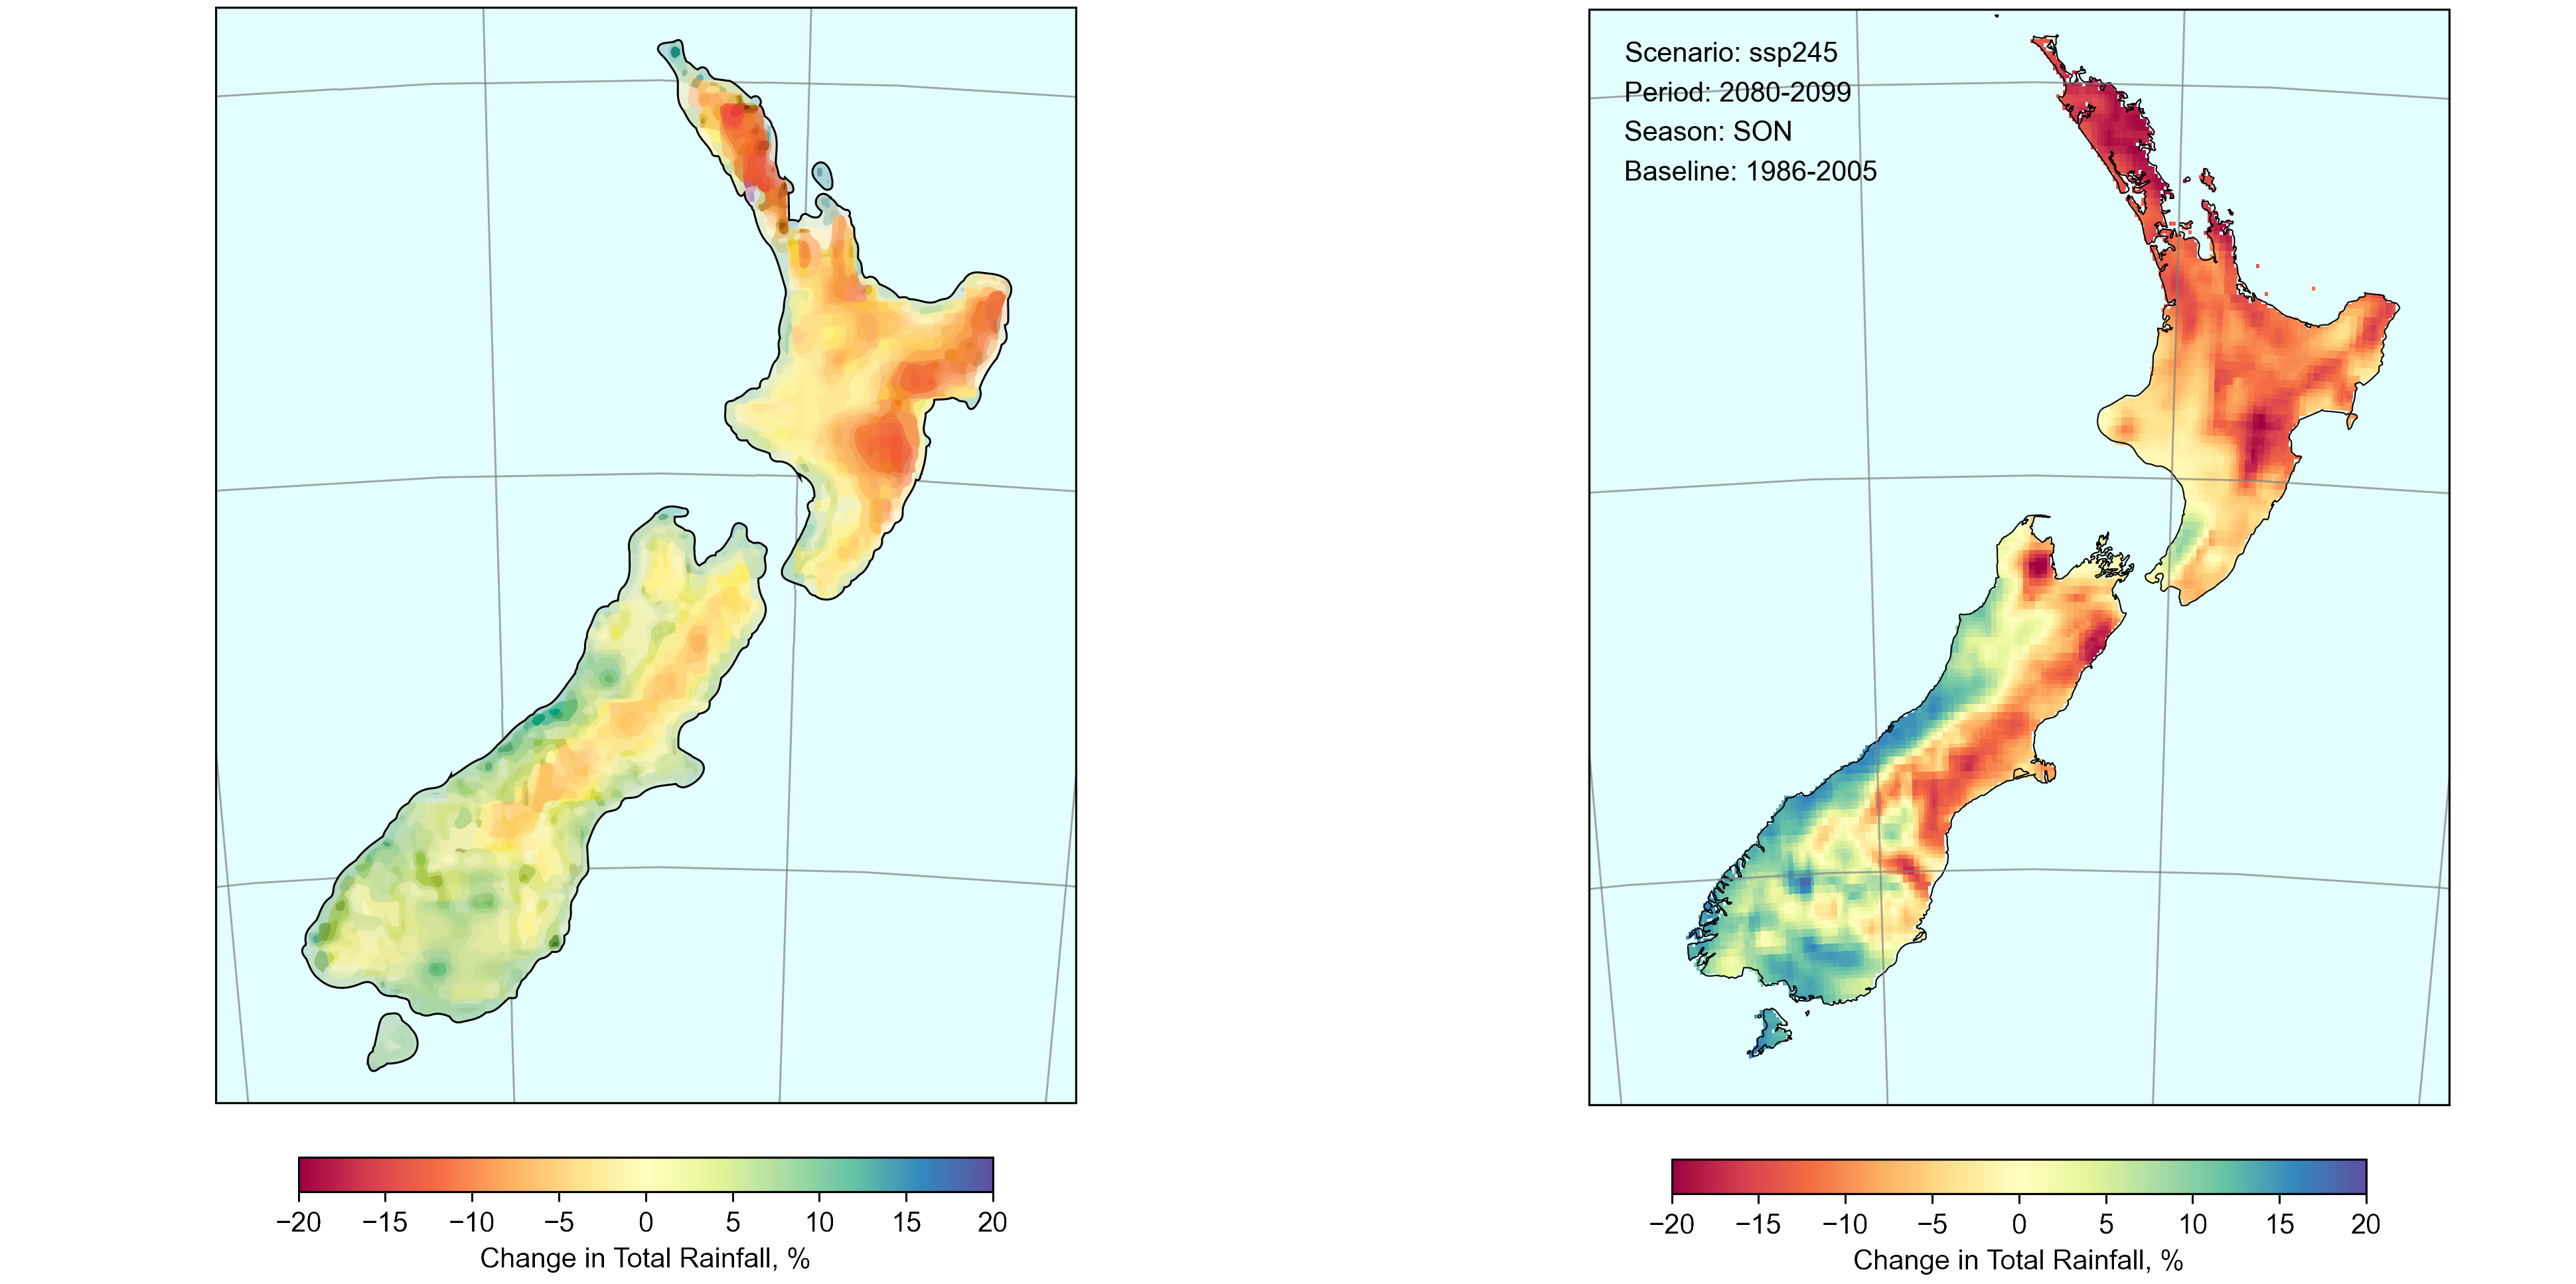
Percentage changes in total precipitation by the end of the century for a moderate emissions scenario for Spring (September-October-November average). Left: previous generation analysis, RCP4.5, 1986-2005 to 2081-2100, adapted from MfE (2018). Right: updated analysis, SSP2-4.5, 1986-2005 to 2080-2099, PwC analysis based on Climate Data Initiative (2024). There are some notable differences at the regional level.
Organisations that rely on physical climate indicators such as those in agriculture, horticulture, and insurance sectors may need to update their risk assessments based on the older data.
Organisations with critical assets concentrated in key locations can now benefit from the more detailed data. For example, the data can help identify suitable sites for renewable energy, such as new solar panels or wind turbines.
Not every organisation urgently needs to perform additional climate change physical risk analysis using these data, but there are significant updates for some regions and sectors with a wealth of new information available.
This new dataset has some significant strengths. Built using transparent, peer-reviewed methods by New Zealand scientists for New Zealand conditions, the results are provided at a high spatial resolution and can provide a common basis for climate-related risk and opportunity assessments that align across sectors.
However, these projections focus primarily on long-term averages and may not be suitable for every use case as many climate-related damages occur during extreme events. Some variables can help show the way extreme events will trend (like the 99th percentile rainfall depth or wind speed), but they’re not designed to show how the frequency might change. The 20-year averages don’t reveal yearly variations or uncertainties across different models. These metrics might be available later or upon request from NIWA and MfE.
Notably, this modelling does not directly include flood risks, as it is assessed in other projects by NIWA. Additionally, NIWA is working on statistical downscaling of more global climate models and more scenarios, which will provide more utility.
New Zealand will face warmer temperatures, more intense rainfall, more hot days, fewer frost days, and longer dry spells for some regions.
NIWA is not the only provider of climate change projections; numerous other providers, both public and private, local and international, offer potentially suitable data. However, assessing the robustness and relevance of these datasets requires expertise. Our Sustainability, Climate and Nature team has extensive experience working with many of these datasets and access to PwC’s global climate and risk community of solvers. We help our clients to build trust and deliver sustained outcomes by advising on the best solutions to fit their needs.
Climate Data Initiative. (2024). New Zealand Climate Projections Dataset. Accessed from https://climatedata.environment.govt.nz/
IPCC. (2013). AR5 WG1 Summary for Policymakers
IPCC. (2021). AR6 WG1 Summary for Policymakers
MfE. (2018). Climate Change Projections for New Zealand. Accessed from https://environment.govt.nz/assets/Publications/Files/Climate-change-projections-2nd-edition-final.pdf
Hunter Douglas
Climate Scientist & Manager, Sustainability, Climate & Nature, Wellington, PwC New Zealand
+64 27 336 2557
{{item.text}}
{{item.text}}


