


Introduction
Kia ora koutou katoa and welcome to the April 2025 edition of our Treasury Broadsheet.
According to the OECD Economic Outlook, Interim Report March 2025, while remaining resilient in 2024, the global economy is still steering through uncertainty. Signs of weakness are appearing globally amid slower growth, persistent inflation, and an unpredictable policy, and geopolitical landscape, made all the more acute this past week with an intense and expanding global trade war.
It is against this backdrop, we explore certain characteristics of the New Zealand Dollar, and offer insights into strategies exporters can use to make the most of a subdued trading range. We also cover reasons for the decline in NZD/USD basis spreads, and currency option dynamics.
Finally, we look at the right sizing of a treasury team to ensure risks are being adequately managed. We hope you find this edition insightful and informative as you continue to navigate through times of volatility and make strategic decisions for your business.
Should you have any questions or wish to discuss the articles further, please reach out to our team using the contact information provided below.
Ngā mihi,

Alex Wondergem
Partner
PwC New Zealand
What's in this edition?
Click on the tabs below to learn more.
Making the most of NZD volatility

Despite being a small, trade-oriented country situated at the bottom of the world, our land of the long white cloud has a currency, the New Zealand Dollar (NZD), that has long batted above its weight. It has consistently been included in the group of G10 currencies; the ten most heavily traded currencies in the world. Supported by our stable economic environment and role in global trade, the NZD also has an advantage due to our reputation as a politically stable nation, with relatively high interest rates. It is considered a high-yielding currency, making it an attractive investment in bullish market conditions.
In financial markets, currencies are often categorised into 'baskets' based on certain risk characteristics. The 'risk-on' basket typically includes the New Zealand Dollar (NZD), Australian Dollar (AUD), Canadian Dollar (CAD) and euro (EUR), while the 'risk-off' basket includes the U.S. Dollar (USD) and Swiss Franc (CHF), Japanese Yen (JPY) and Swedish Krona (SEK).
The NZD is known as a 'risk-on' currency, benefiting from positive economic conditions. 'Risk-on' currencies are those that tend to appreciate in value when investors are feeling optimistic about global economic conditions and are willing to take on more risk in pursuit of higher returns. ’Risk-off’ currencies are those that investors typically favour during times of economic uncertainty, market volatility, or geopolitical tensions. These currencies are perceived as safer investments due to their association with stable and economically resilient countries.
A ‘safe haven currency’ and a ‘risk-off currency’ are related concepts, but are not exactly the same. A ‘safe haven currency’ is stable during turmoil, while a ‘risk-off currency’ reflects the behaviour of investors when they move toward safer currencies (USD) during periods of risk aversion.
NZD/USD exchange rate volatility
So why is the NZD/USD exchange rate particularly volatile? If we consider the volatility of the NZD, the NZD/USD exchange rate generally shows greater fluctuation compared to the NZD/AUD due to several key factors. Consider a cross-currency see-saw, when one goes up the other goes down. Over the past twenty years, the NZD/USD exchange rate has seen significant volatility, moving within a 40 cent range, due to various factors. As the world’s reserve currency, the USD is heavily influenced by global economic conditions such as U.S. monetary policy, geopolitical and trade dynamics (tariffs).
Risk sentiment also heavily influences both currencies, with the NZD considered a ‘risk on’ currency, and the USD, a ‘risk off’ currency, as previously stated. Interest rate expectations in the U.S. tend to have a wide ranging impact due to the size and influence of the U.S. economy. These are just some examples of currency drivers.
Conversely, across this same time period, the NZD/AUD cross-currency rates have moved within a 27 cent range. Both New Zealand and Australia have economies that are significantly influenced by commodity exports. However, the NZD/AUD exchange rate is less sensitive to global commodity price fluctuations than the NZD/USD rate because both currencies are affected similarly by changes in commodity markets. The NZD/AUD exchange rate is more influenced by regional economic conditions, domestic monetary policy, and trade relationships between New Zealand and Australia. It tends to be more stable and predictable compared to the broader global factors affecting the NZD/USD rate.
The NZD/USD may be tricky to predict, but unlike equities which can often take years to recover from dips, it tends to see-saw back from lows, and often quite quickly.
Taking into account this volatility and factors that influence the NZD/USD trading range, we can observe how it reacts after experiencing significant suppression—defined as trading more than 15% below its seven-year moving average. Unsurprisingly, these periods often coincide with episodes of heightened risk aversion, or a black swan event (e.g. the Global Financial Crisis or the COVID-19 pandemic). As the saying goes, “make hay while the sun shines”, and for export managers of financial market risk, periods of heightened volatility and currency trading troughs, can offer up opportunities to lock in and benefit from advantageously low trading levels.
“Markets can remain irrational longer than you can remain solvent.”
John Maynard KeynesFor import managers of financial market risk, in times of suppression in the NZD/USD, history typically shows that patience can pay off. However, the unpredictable nature of currency markets and the potential risks of delaying action when there is belief that trading behaviour is irrational. By proactively managing currency risks before facing an unfavourable foreign exchange trading range, you are often better positioned to ride it out and afford the time to wait.
A common way exporters can benefit during depreciation in the NZD is in the use of currency options. These hedging instruments can be used strategically and as a means to increase foreign exchange hedging beyond the use of more simple forward exchange contracts. In using currency options, even those simplistic in nature, such as a collar, allows an exporter to be protected on the upside, and participate on the downside, benefitting to a predetermined level. We also see use of a filter test mechanism during periods of NZD appreciation. A filter test is triggered at a rate particularly favourable, that allows a business to hedge more than typical, for a longer period of time.
NZD/USD and the response of filter test activation:
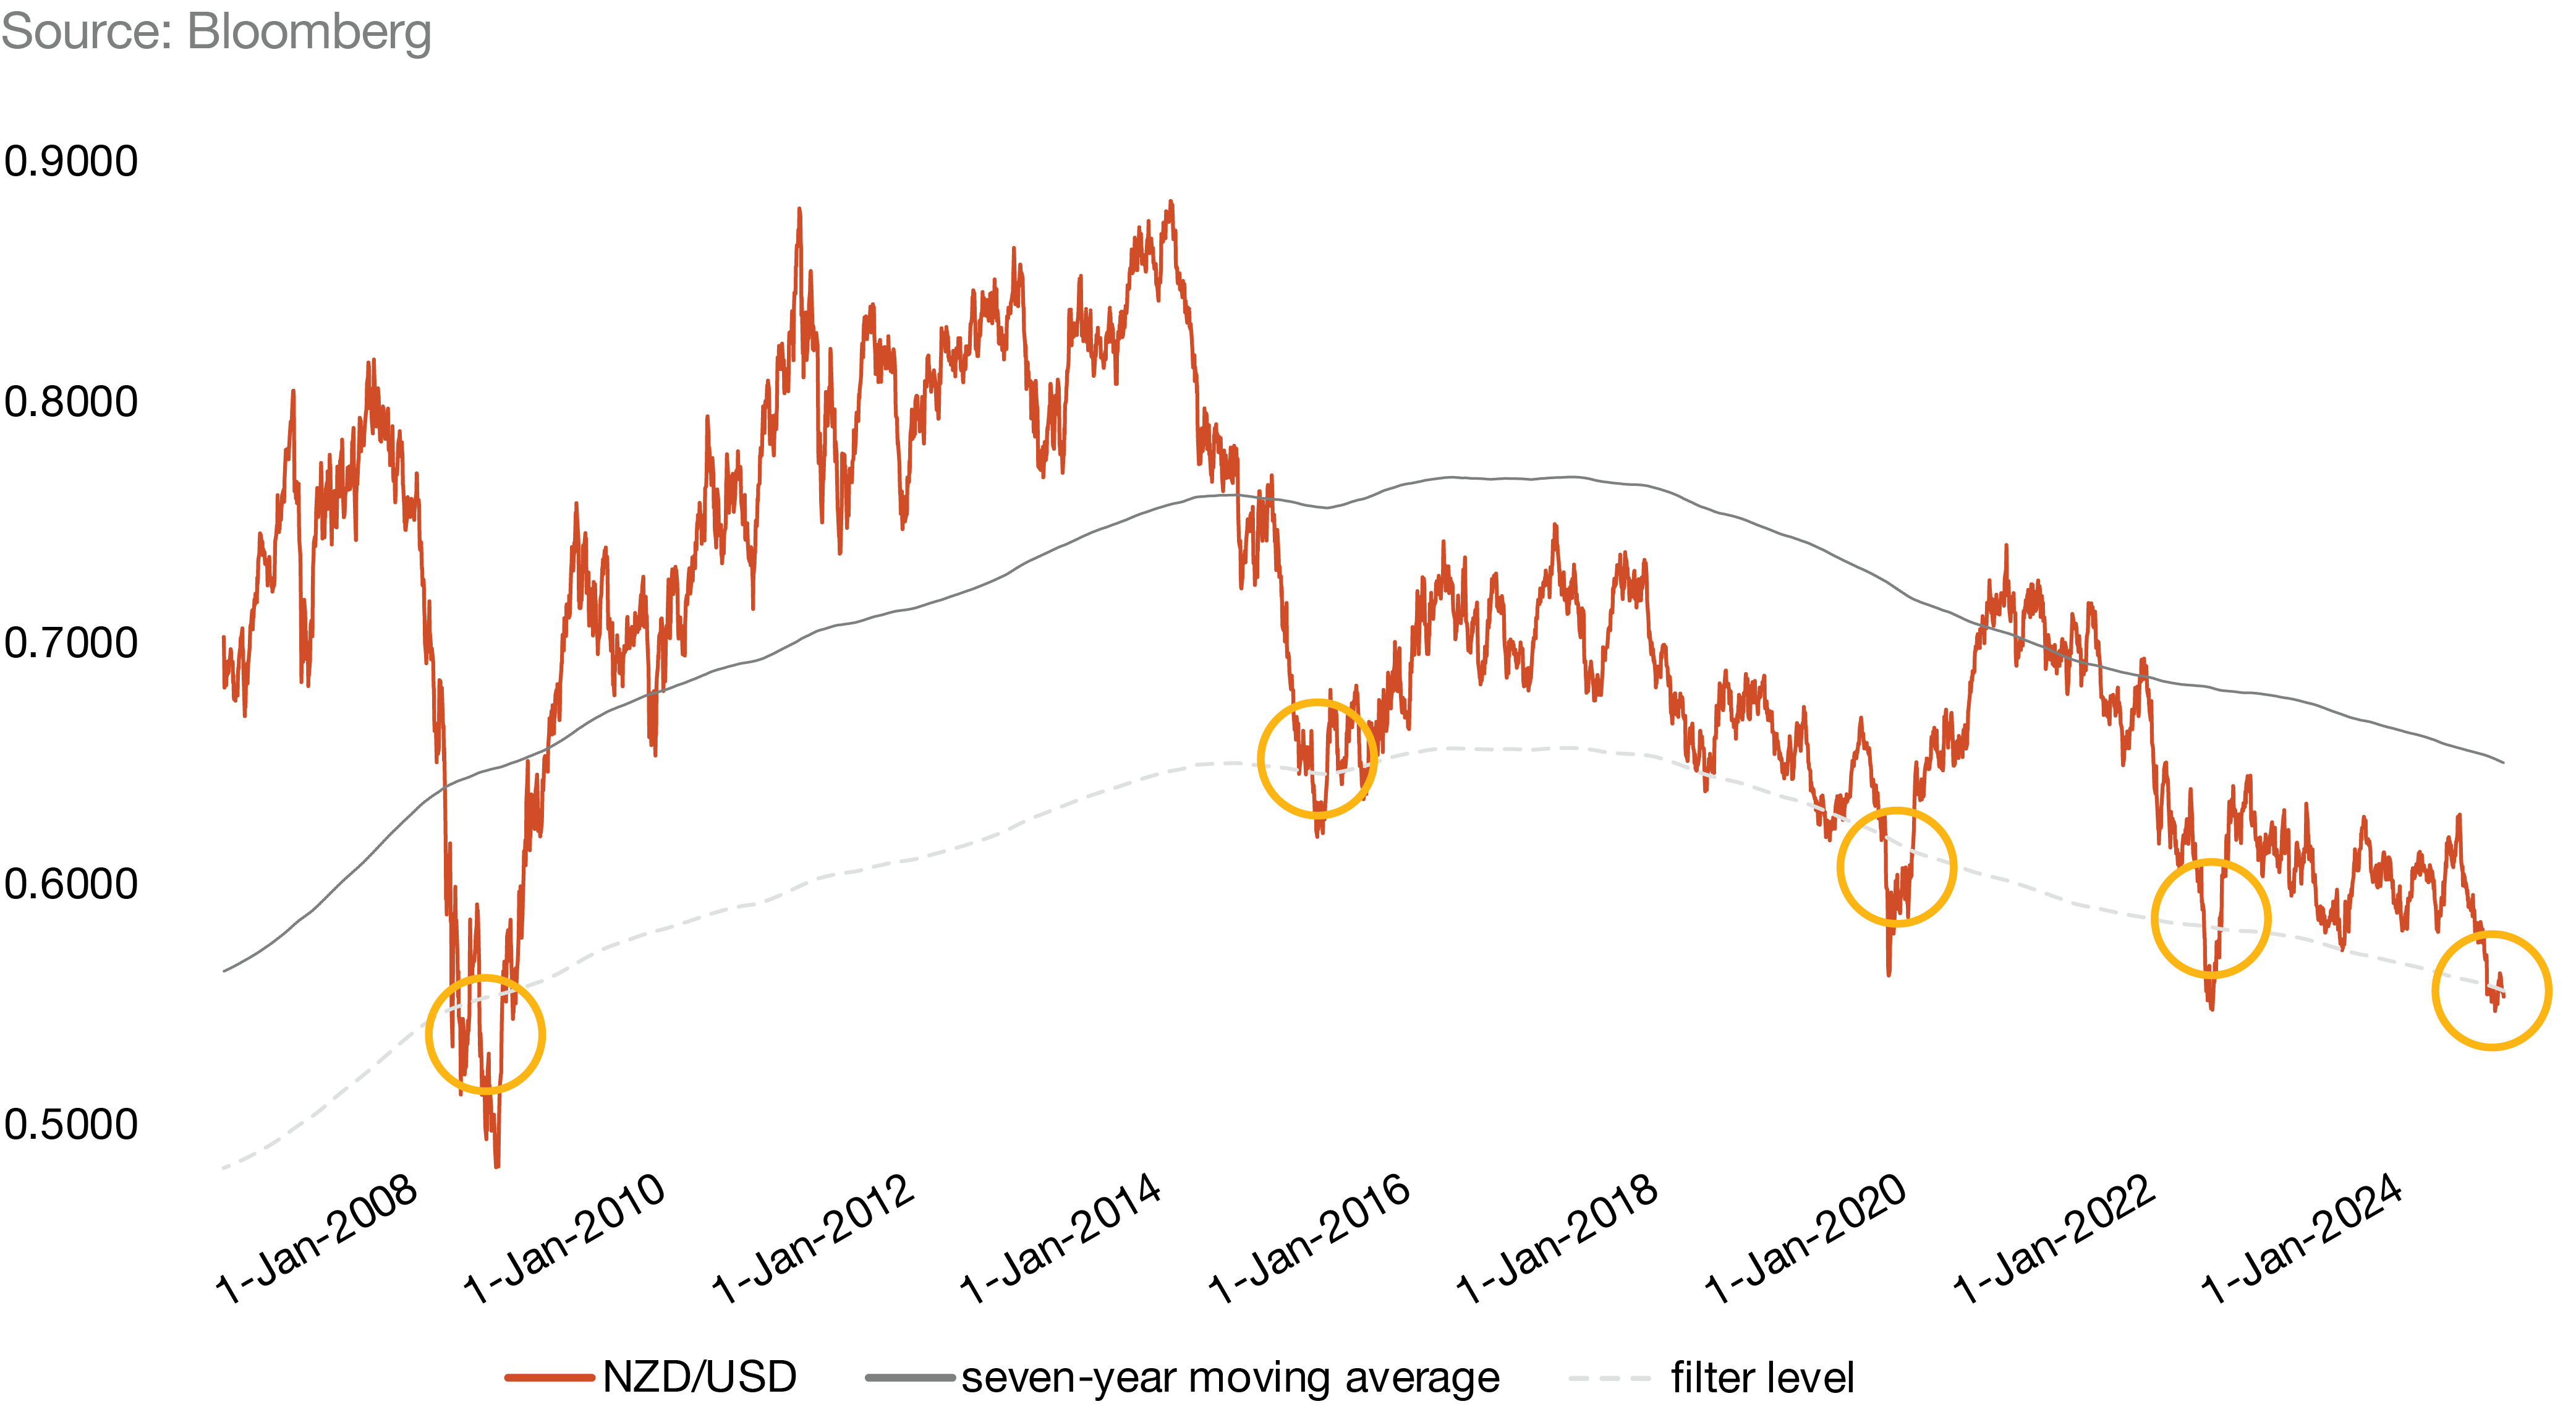
NZD/USD filter test: identifying undervaluation and opportunities
- A filter test is a mechanism used to identify periods when the NZD/USD exchange rate is significantly suppressed, specifically trading more than 15% below its seven-year moving average.
- This filter is designed to detect extreme undervaluation in the currency pair.
- It is activated infrequently, having been triggered only six times over the past 15 years. Each time coincides with periods of heightened risk aversion or unexpected events.
- Once activated, the filter remains active for only a few weeks before the conditions that triggered the filter begin to reverse.
- The purpose of a filter test is to identify potential opportunities in the NZD/USD market, as historical data shows that the exchange rate tends to recover following these periods.
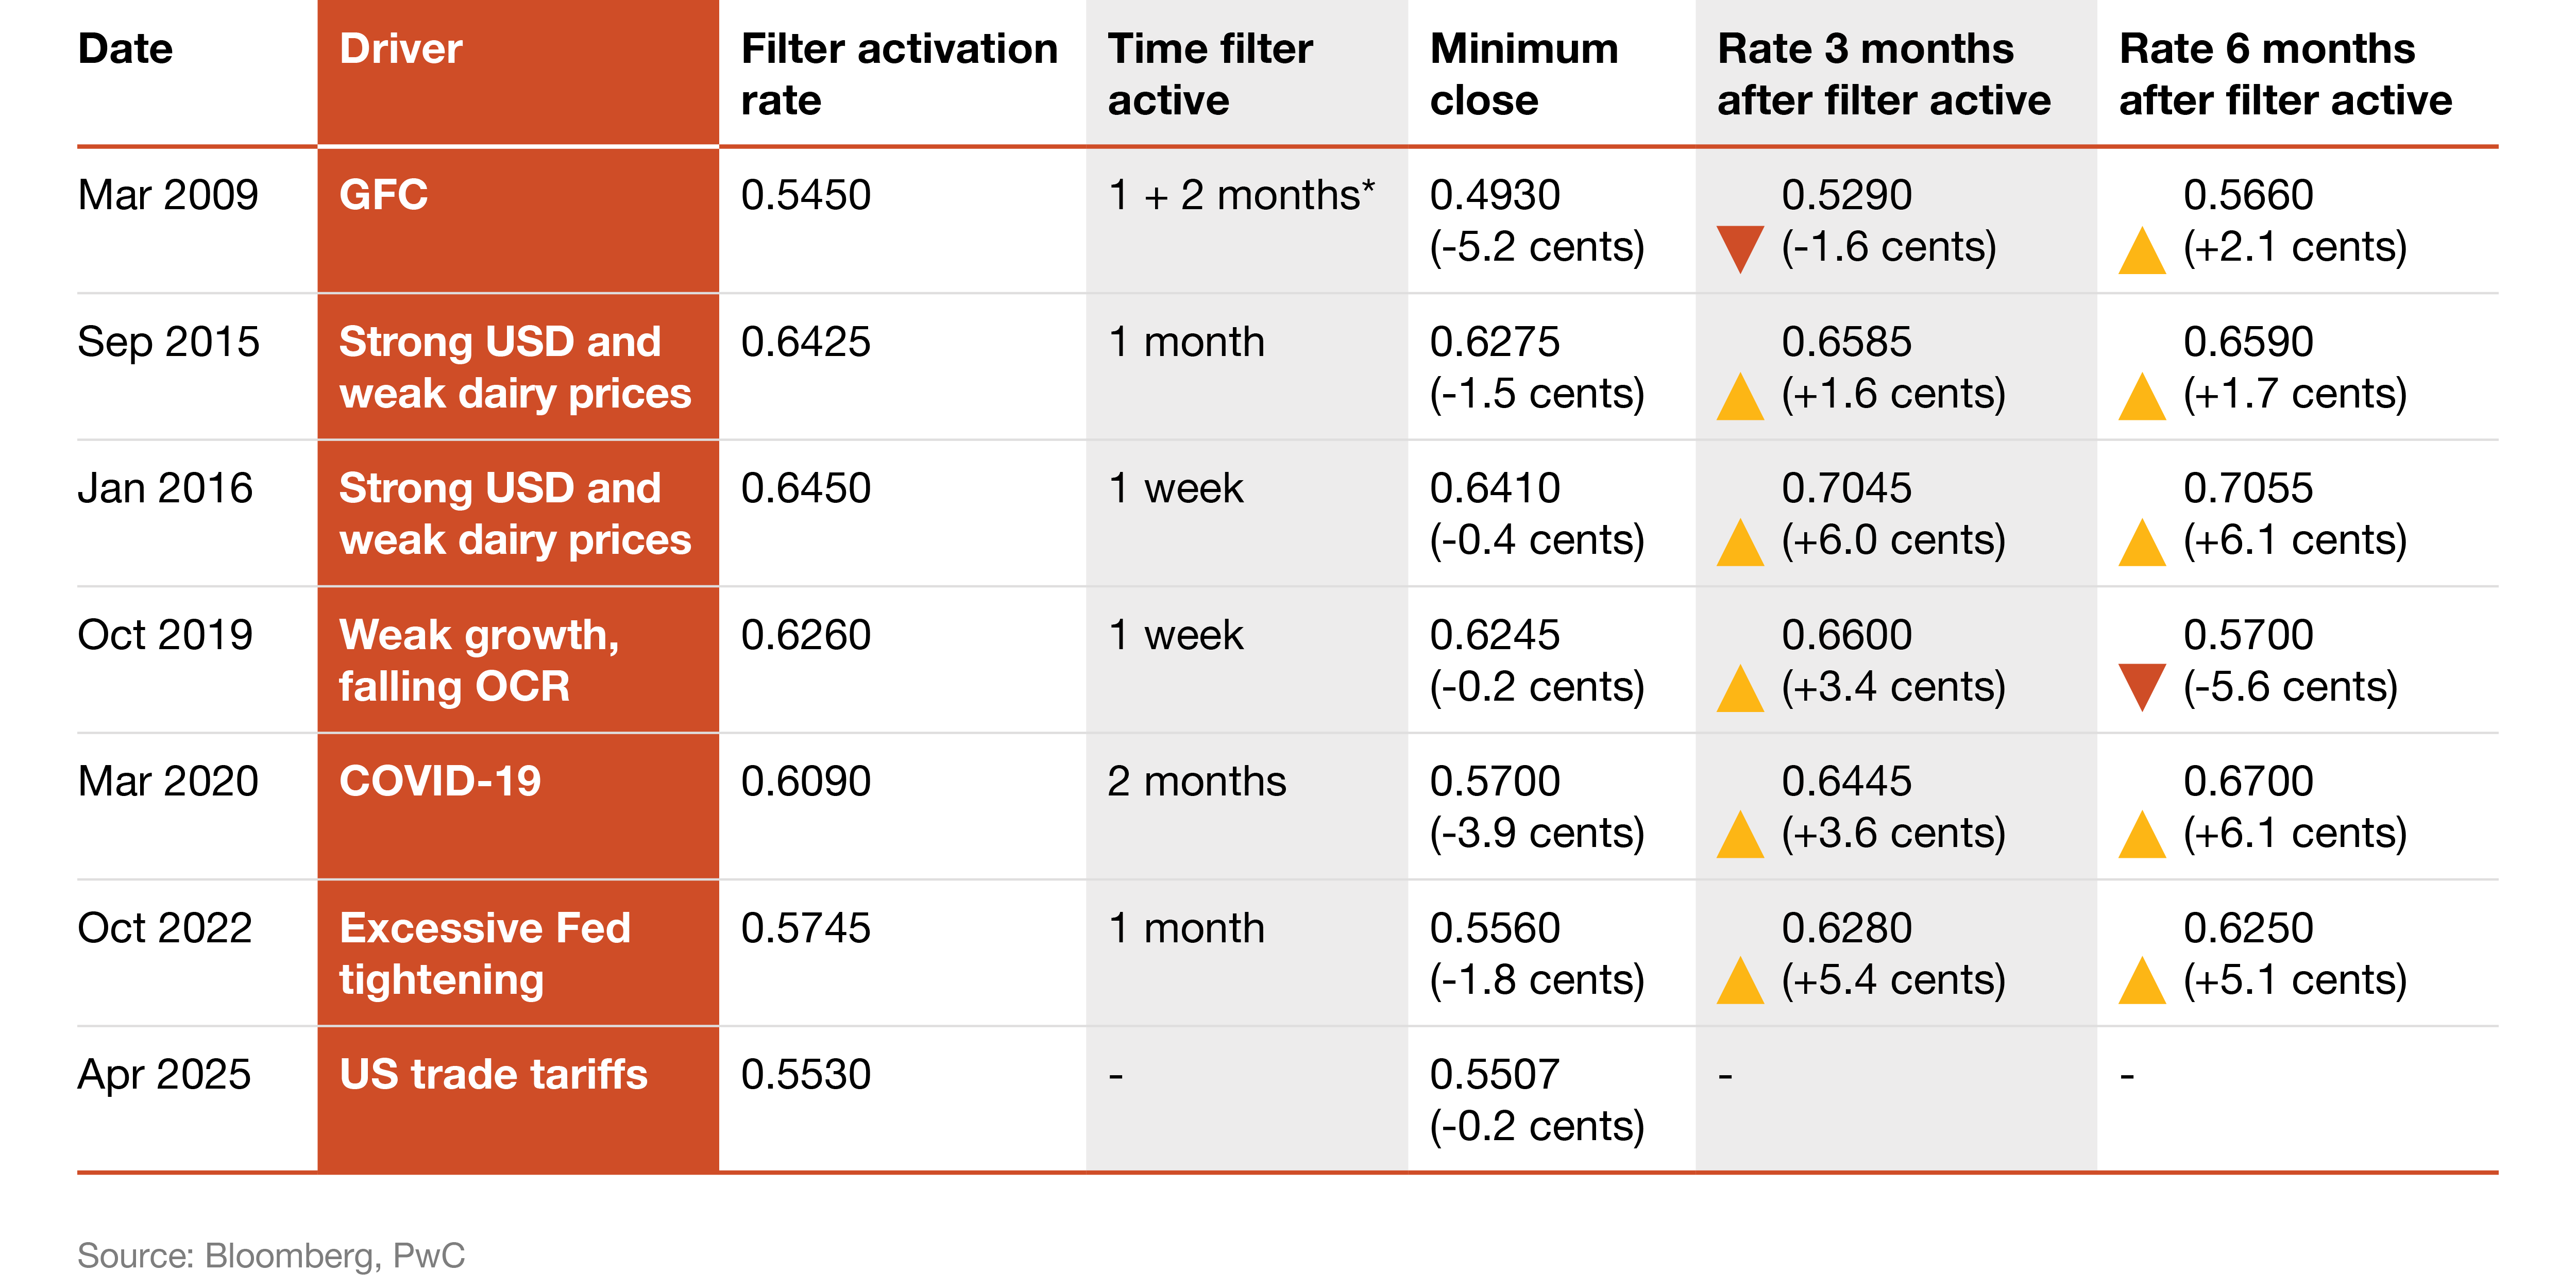
- After the filter is activated, the NZD/USD has historically recovered by at least 1.6 cents within three to six months, with an average increase of 3 cents after three months and 2.6 cents after six months.
- This pattern suggests that the market often overreacts to negative shocks, and once the initial pessimism subsides, the NZD/USD tends to rebound, offering potential for gains.
Visual representation of the economic events and conditions that drove currency trading to the levels triggering filter activation:
If approached proactively, there are various ways to protect your business from negative market swings and take advantage of moves in your favour. Given its susceptibility to market sentiment, the NZD can be difficult to predict; however, by utilising a range of different hedging instruments and execution strategies, FX risk managers can ensure their underlying objectives are met, and make the most of opportunities that arise from ongoing market volatility.
Authored by Duncan Roff
Back to the tabs
The drop in the NZD/USD basis swap following the shift to US SOFR

To start with, what is a basis swap? A basis swap is an interest rate ‘swap’ that converts interest (and usually principal) payments in one currency into those of a different currency. Basis swaps are focused on the floating-to-floating rate leg between currencies, e.g. from USD SOFR to NZD BKBM.
Typically, basis swaps are used to hedge the principal and interest payments that arise when an entity borrows or invests in a foreign currency. Any fixed rate hedging, say in USD, is managed separately with a regular interest rate swap (e.g. from fixed to floating). Relatedly, the FX risk component of any transaction (i.e. principal payments and repayment) can also be wrapped into this conversion, and this is known as a Cross Currency Interest Rate Swap (CCIRS), of which the basis swap is included.
A basis swap is expressed as a ‘spread’ (usually in basis points), which is applied (either added or subtracted) to the non-USD denominated currency. This basis spread reflects the cost of swapping into another currency on a temporary basis. The basis spread applied is a reflection of the credit and liquidity risk of underlying money market rates (Bank Bill Reference Rates - BKBM vs. Secured Overnight Financing Rate - SOFR) as well as the demand and supply for either currency involved in the CCIRS (NZD vs. USD). The spread is applied to periodic interest rate payments that occur between the parties involved. This article aims to explore reasons for the decline in NZD/USD basis spreads over the past few years.
Post the GFC in 2008, basis swaps were an important and volatile component of offshore funding decisions. This provided borrowers with some strategic options towards managing these risks. The recent decline in basis swap levels and volatility has reduced the materiality of these risks.
Assuming a New Zealand-based borrower is raising funds offshore (e.g. in USD), under a full CCIRS they will exchange the principal amounts (in both currencies) at the prevailing market exchange rate. This is the initial ‘swapping’ of currencies. This occurs with a swap bank or similar counterparty.
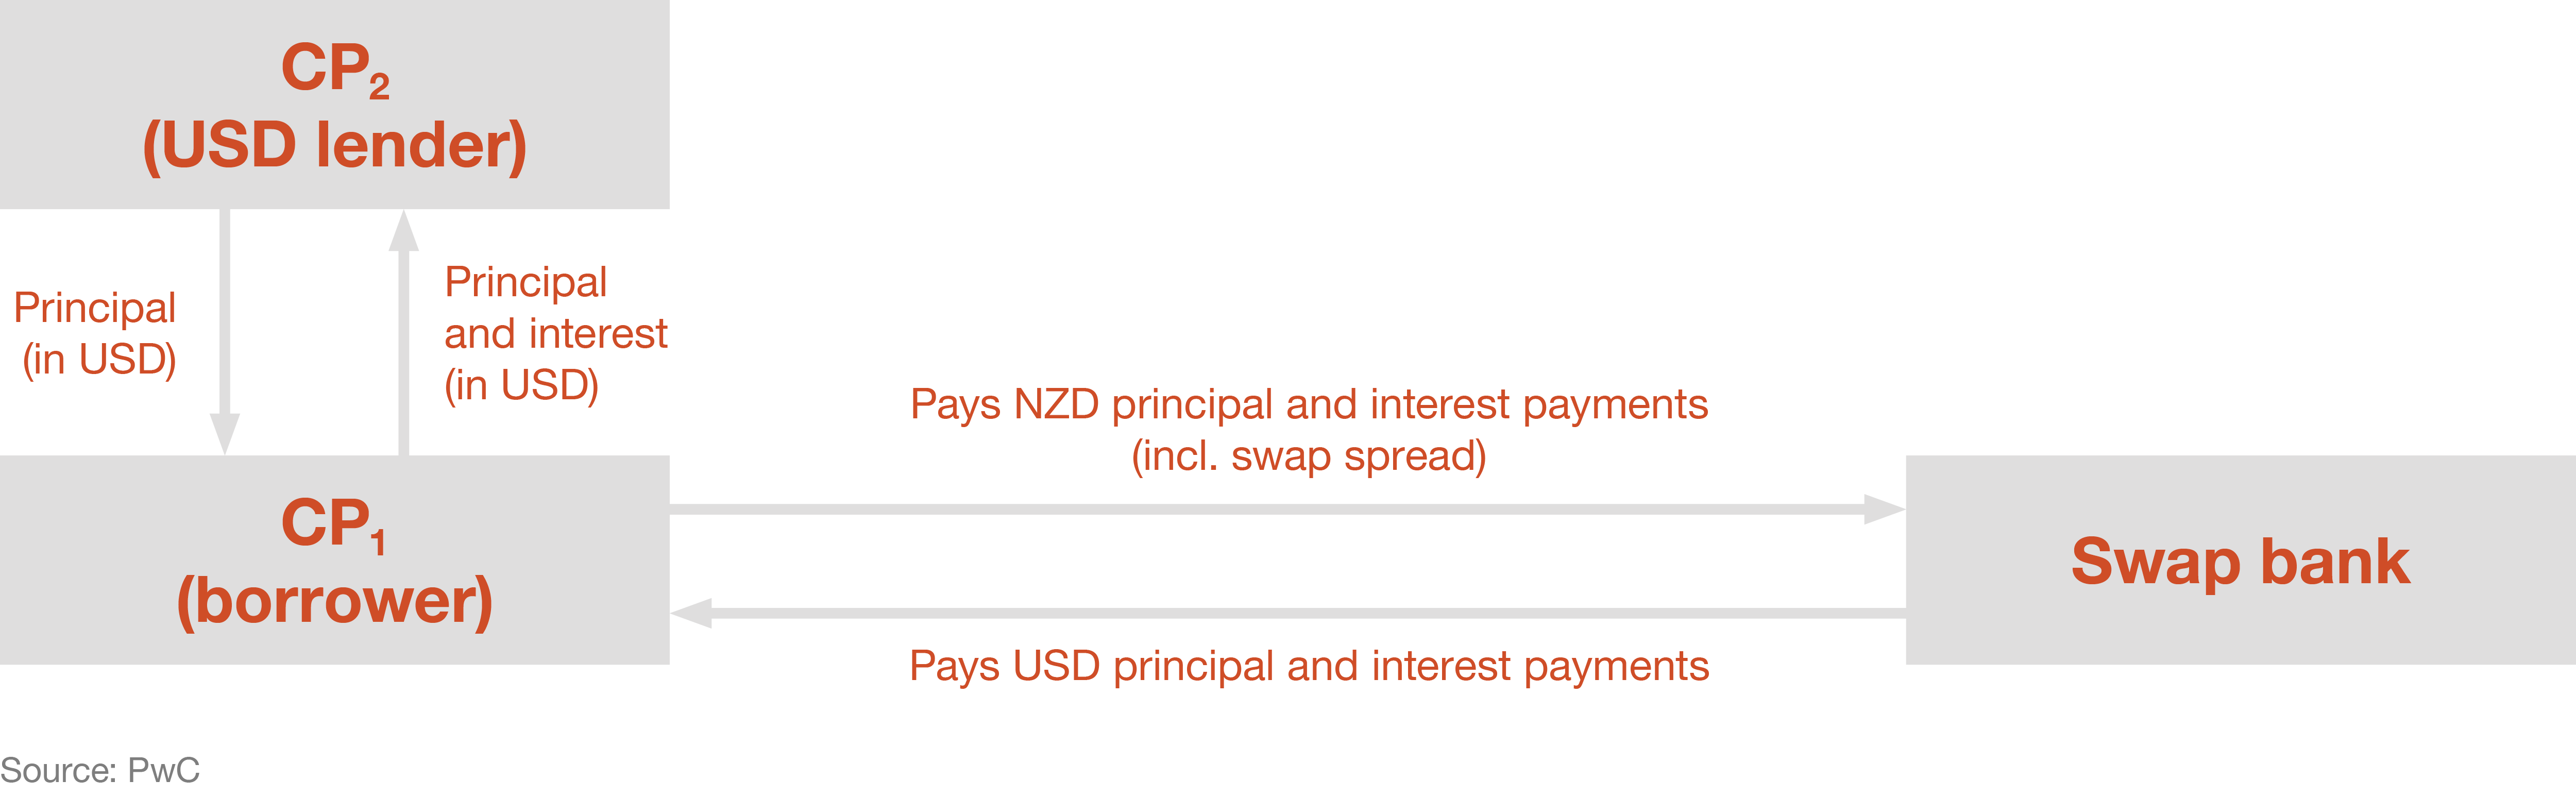
The periodic interest payments will then occur over the life of the swap. These payments are based on the relevant money market reference rates (BKBM and SOFR). The additional spread attached to the NZD denominated flow of funds is usually held constant over the life of the swap (i.e. the basis swap term matches the term of the underlying instrument). This spread is determined at the inception of the swap (i.e. the basis swap spread).
Finally at the conclusion of the swap (and loan), the original principal amounts will be swapped back, at the same rate used in the first exchange and used to repay the lender.
Why has the spread on the NZD/USD basis swap decreased in recent years? Firstly, let’s examine NZD/USD basis spreads over time (January 2015 - January 2025).
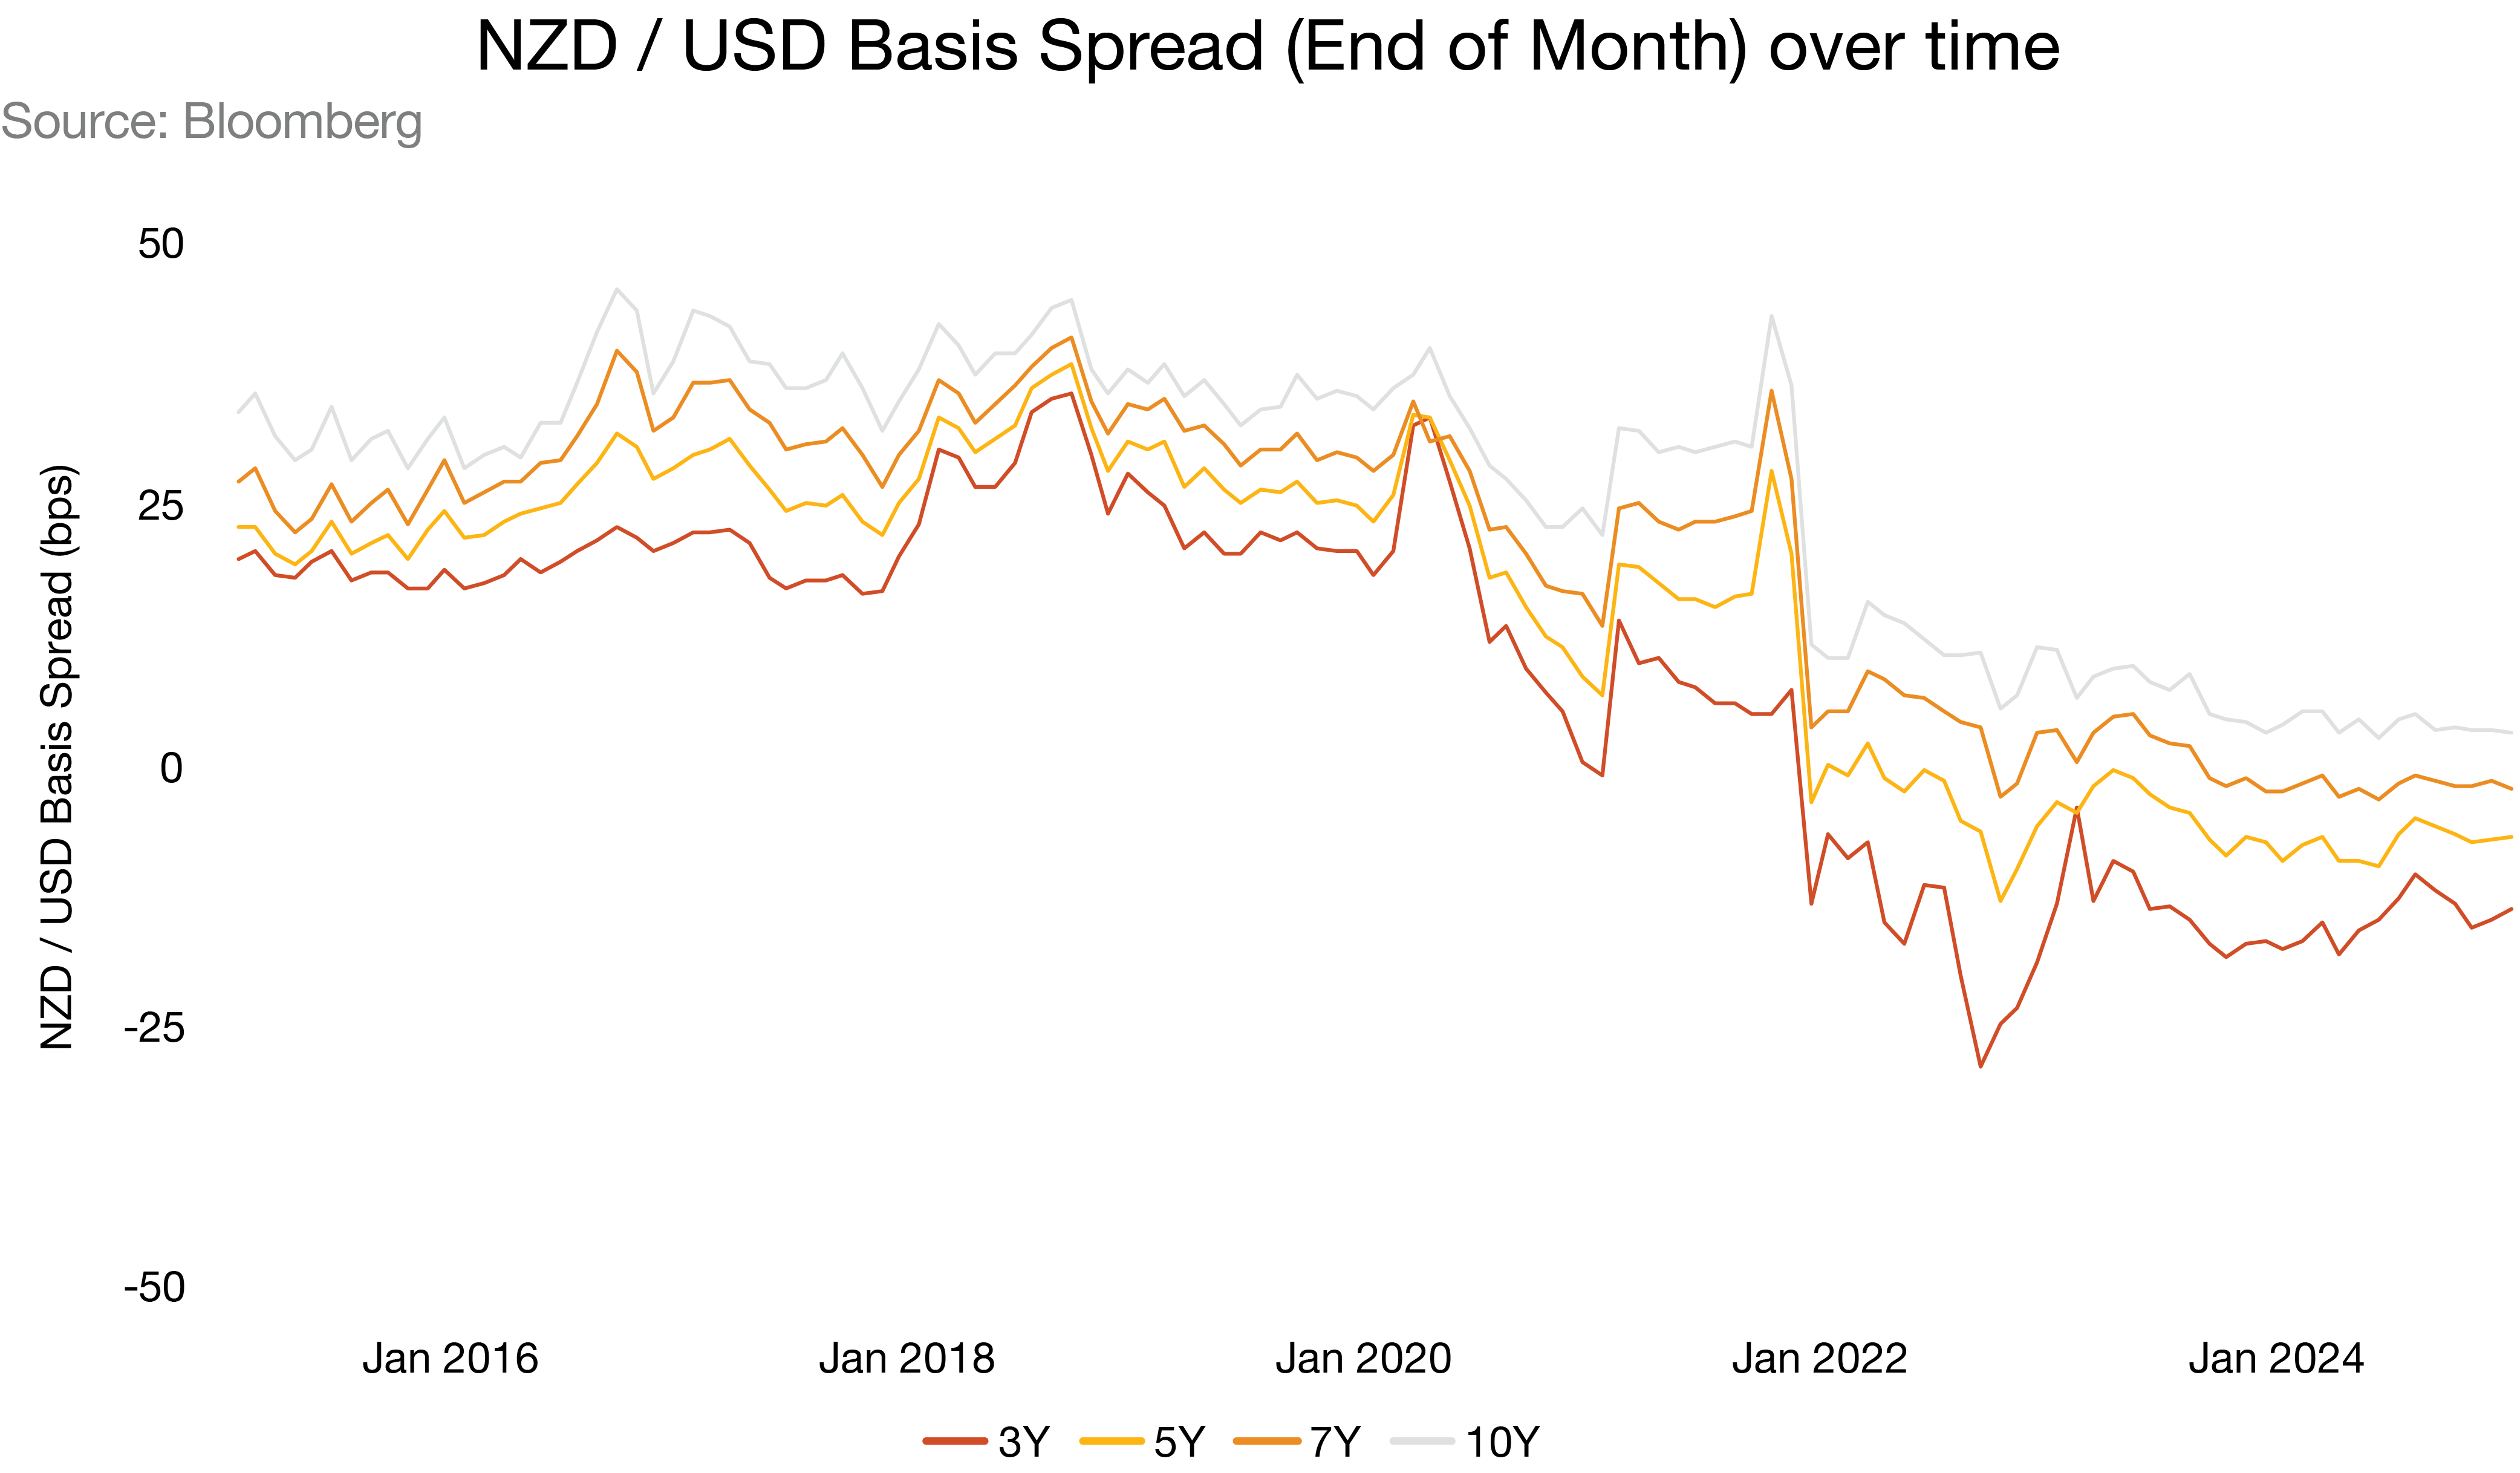
Prior to the GFC, there was minimal cost to basis swap spreads given the loose financial regulations across the major economies and the general abundance of US dollar funding spread through global financial markets. The tightening of financial regulation that followed, such as higher capital requirements and more stable funding sources, reduced excess US dollar availability and drove up the cost of basis swaps (due to a mismatch between the supply and demand for USD funding).
For New Zealand, this drove the NZD/USD basis swap spreads higher - to between 25-30 basis points for 7 to 10 year tenors. For simplicity purposes, a positive spread (which is added to the non-USD denomination) essentially means that New Zealand borrowers were forced to pay a premium to swap out of USD lending into NZD denominated debt.
Compare this with the landscape now, and it's clear to see that spreads have come in, and have even shifted negative in some tenors of swaps. So what has driven this movement and how much is explained by the change in US floating reference rates?
Above we discussed that a driving function of the basis spread was the underlying credit risk of each money market reference rate. The reference rate in New Zealand is the Bank Bill Reference Rates (BKBM). BKBM is calculated using data collected from a panel of contributor banks in which they submit the rates at which they’re lending unsecured funds to other banks (during a measurement window) on a daily basis. The highest and lowest submissions are then omitted and an average is calculated. This mechanism was first introduced in the 1980s and has not materially deviated in its method of calculation.
The money market reference rate used in the United States has undergone some shifts though. Initially, USD LIBOR (London Interbank Offered Rate) was the main reference rate. This rate was calculated similarly to BKBM, from a panel of bank submissions with the same omission of the highest and lowest estimate, in USD. However, due to scandals relating to the integrity of LIBOR, the Federal Reserve began looking at alternative measures that were a better reflection of U.S. money markets and not manipulatable.
The credibility of LIBOR was under the microscope following the 2008 GFC. During the 'LIBOR Scandal' that followed, it was revealed that a select group of banks had been deliberately underreporting their borrowing costs, misleadingly suggesting they were in a stronger financial position and attempting to profit from these moves.
Eventually, SOFR (the Secured Overnight Financing Rate) was decided as the preferred replacement (circa June 2017). This began being formally published by the Federal Reserve in April of 2018, though this transition period was gradual, with many contracts and financial instruments still referencing the USD LIBOR until their cessation dates.
SOFR is calculated using real-life transactions in the overnight repurchase market, where funds are lent while being collateralised with US Treasury Securities. In this sense, the credit risk element fundamentally differs between SOFR and LIBOR, as SOFR is a rate secured by US Treasury securities which are largely considered ‘risk-free’. A simple way of visualising the difference between SOFR and LIBOR is plotting them against each other. As SOFR has a lower credit risk when compared to LIBOR, we’d expect that this would be reflected by a lower overall rate. This is evident in the premium that LIBOR has generally traded at above SOFR (has averaged ~ 32 bps since June 2018).
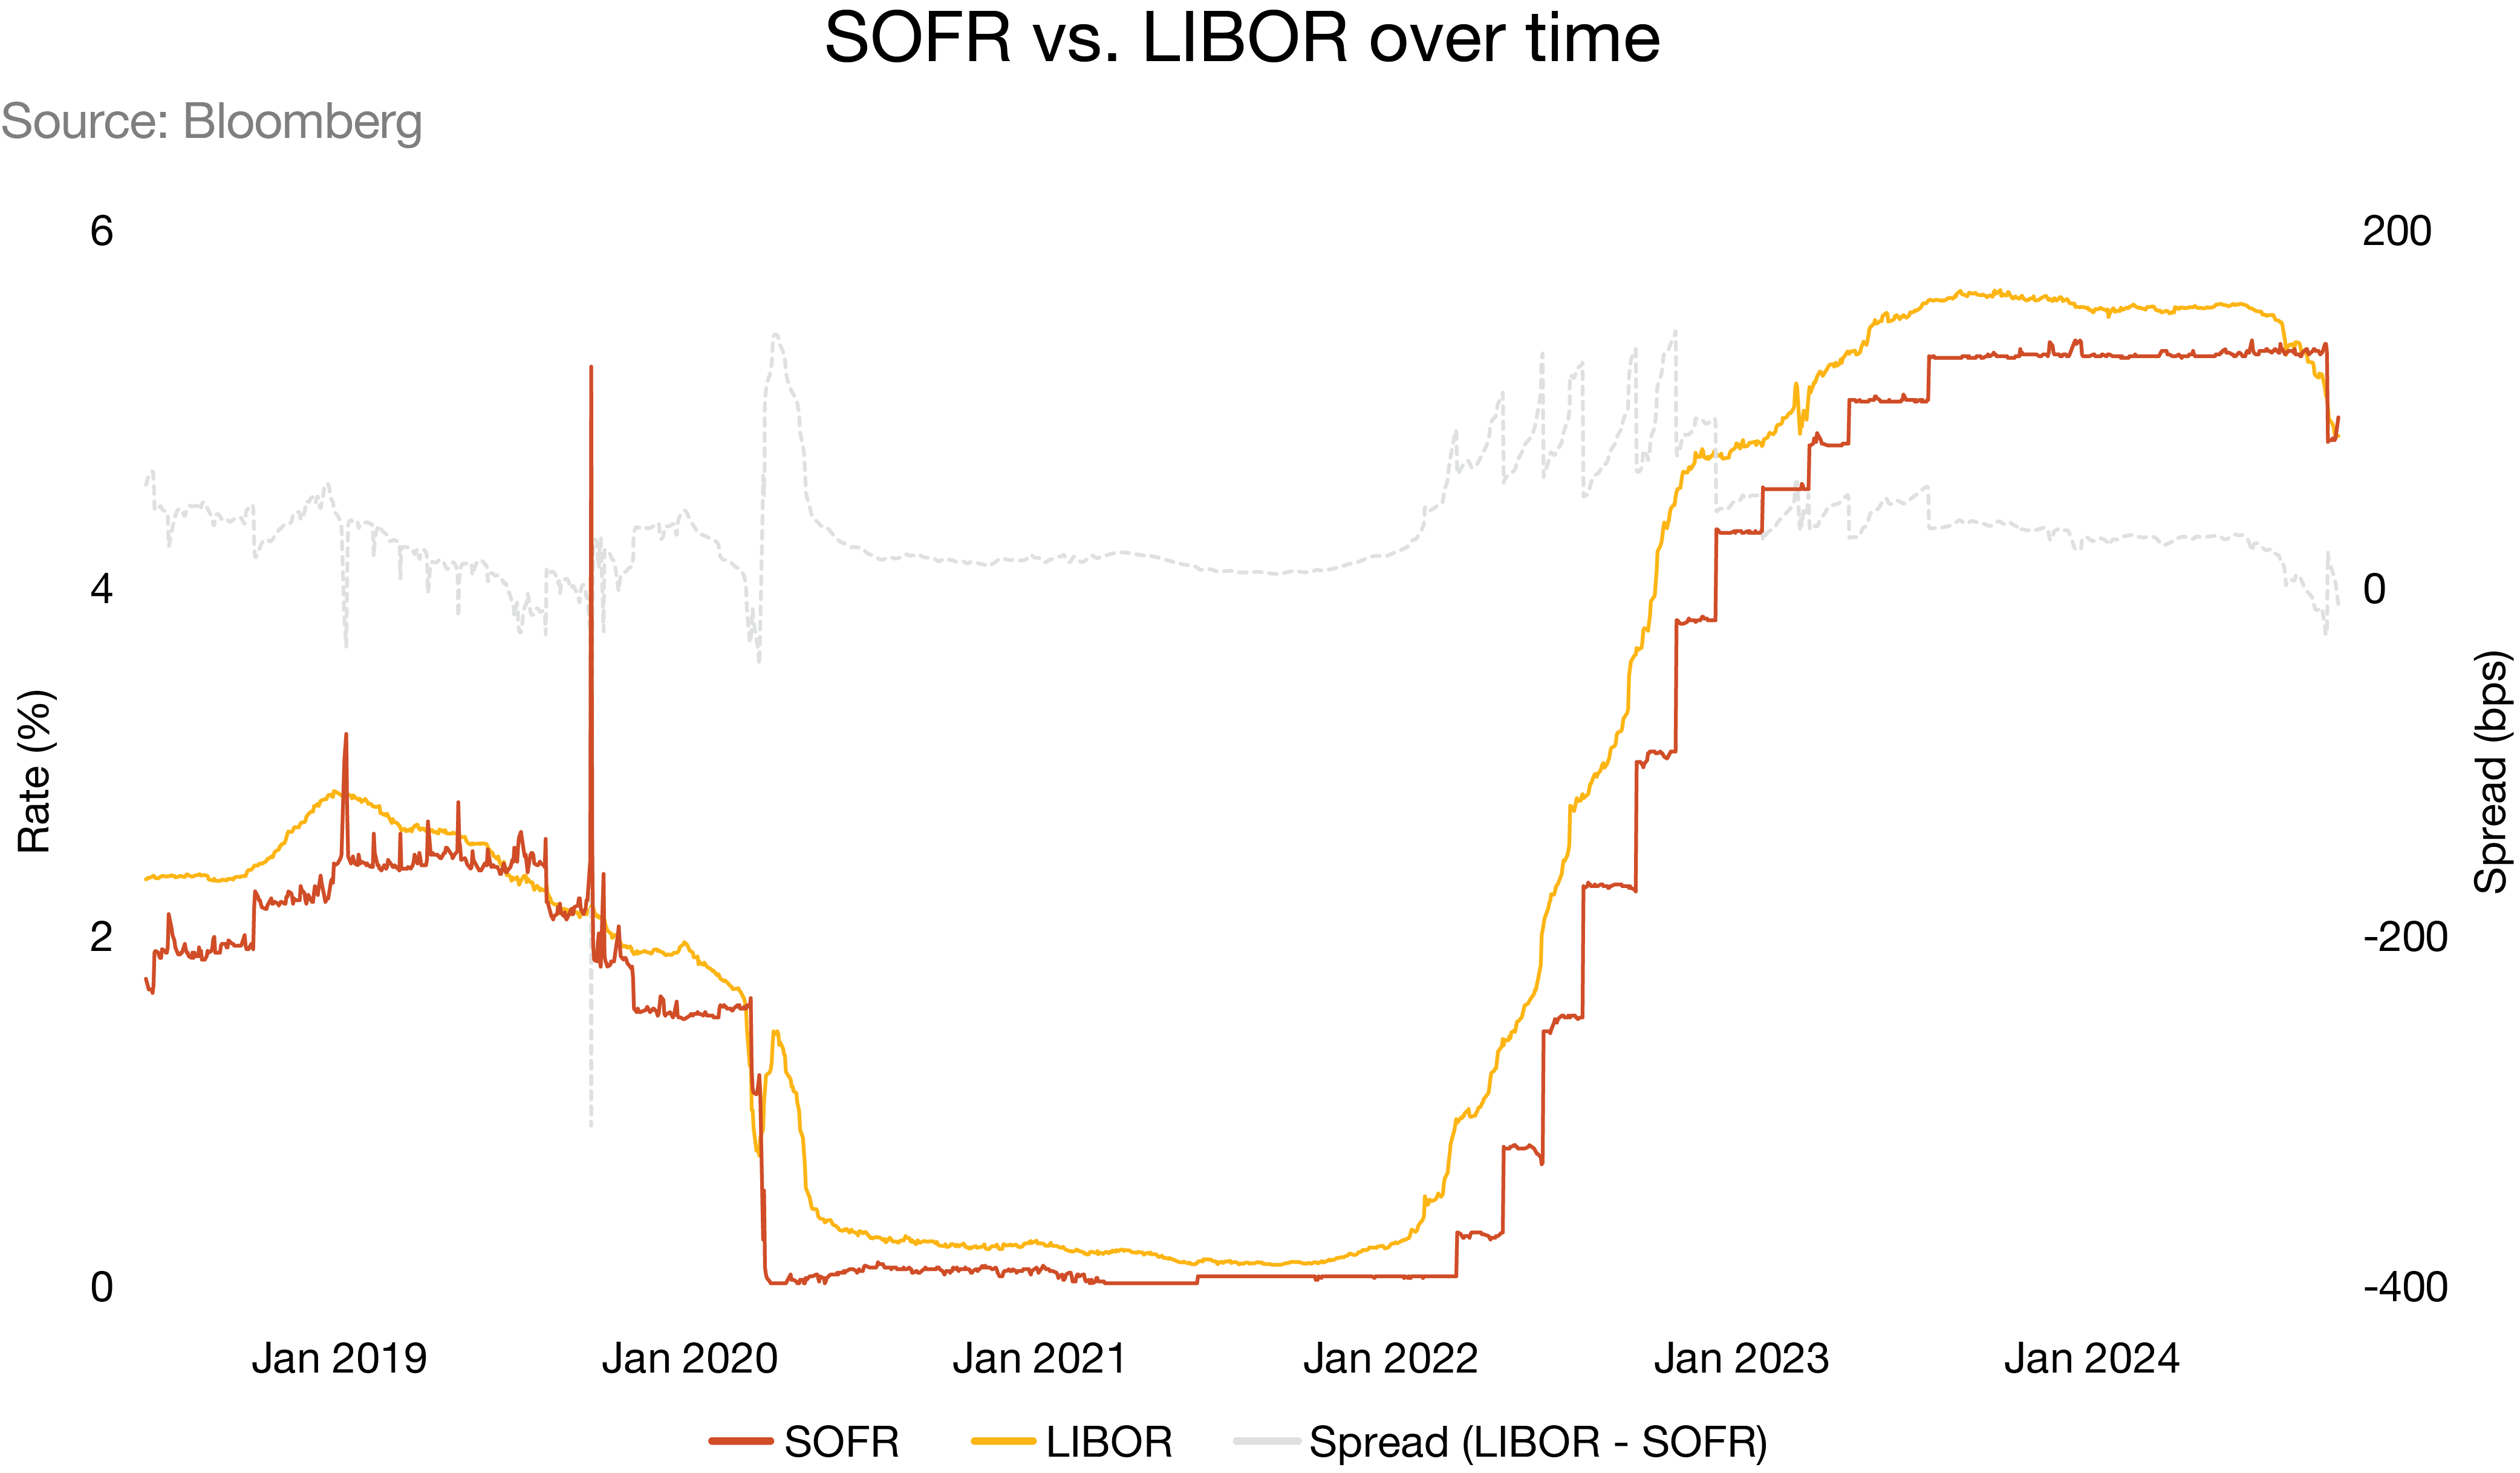
The expectation (in terms of basis spreads) would be that once SOFR became fully implemented, the basis spread for NZD/USD would reduce, as now there is less compensation required for the non-USD leg of the swap due to the relative reduction in credit risk associated with SOFR.
Let’s take a closer look at the above chart with some key events identified on it, and see if this expectation holds true.
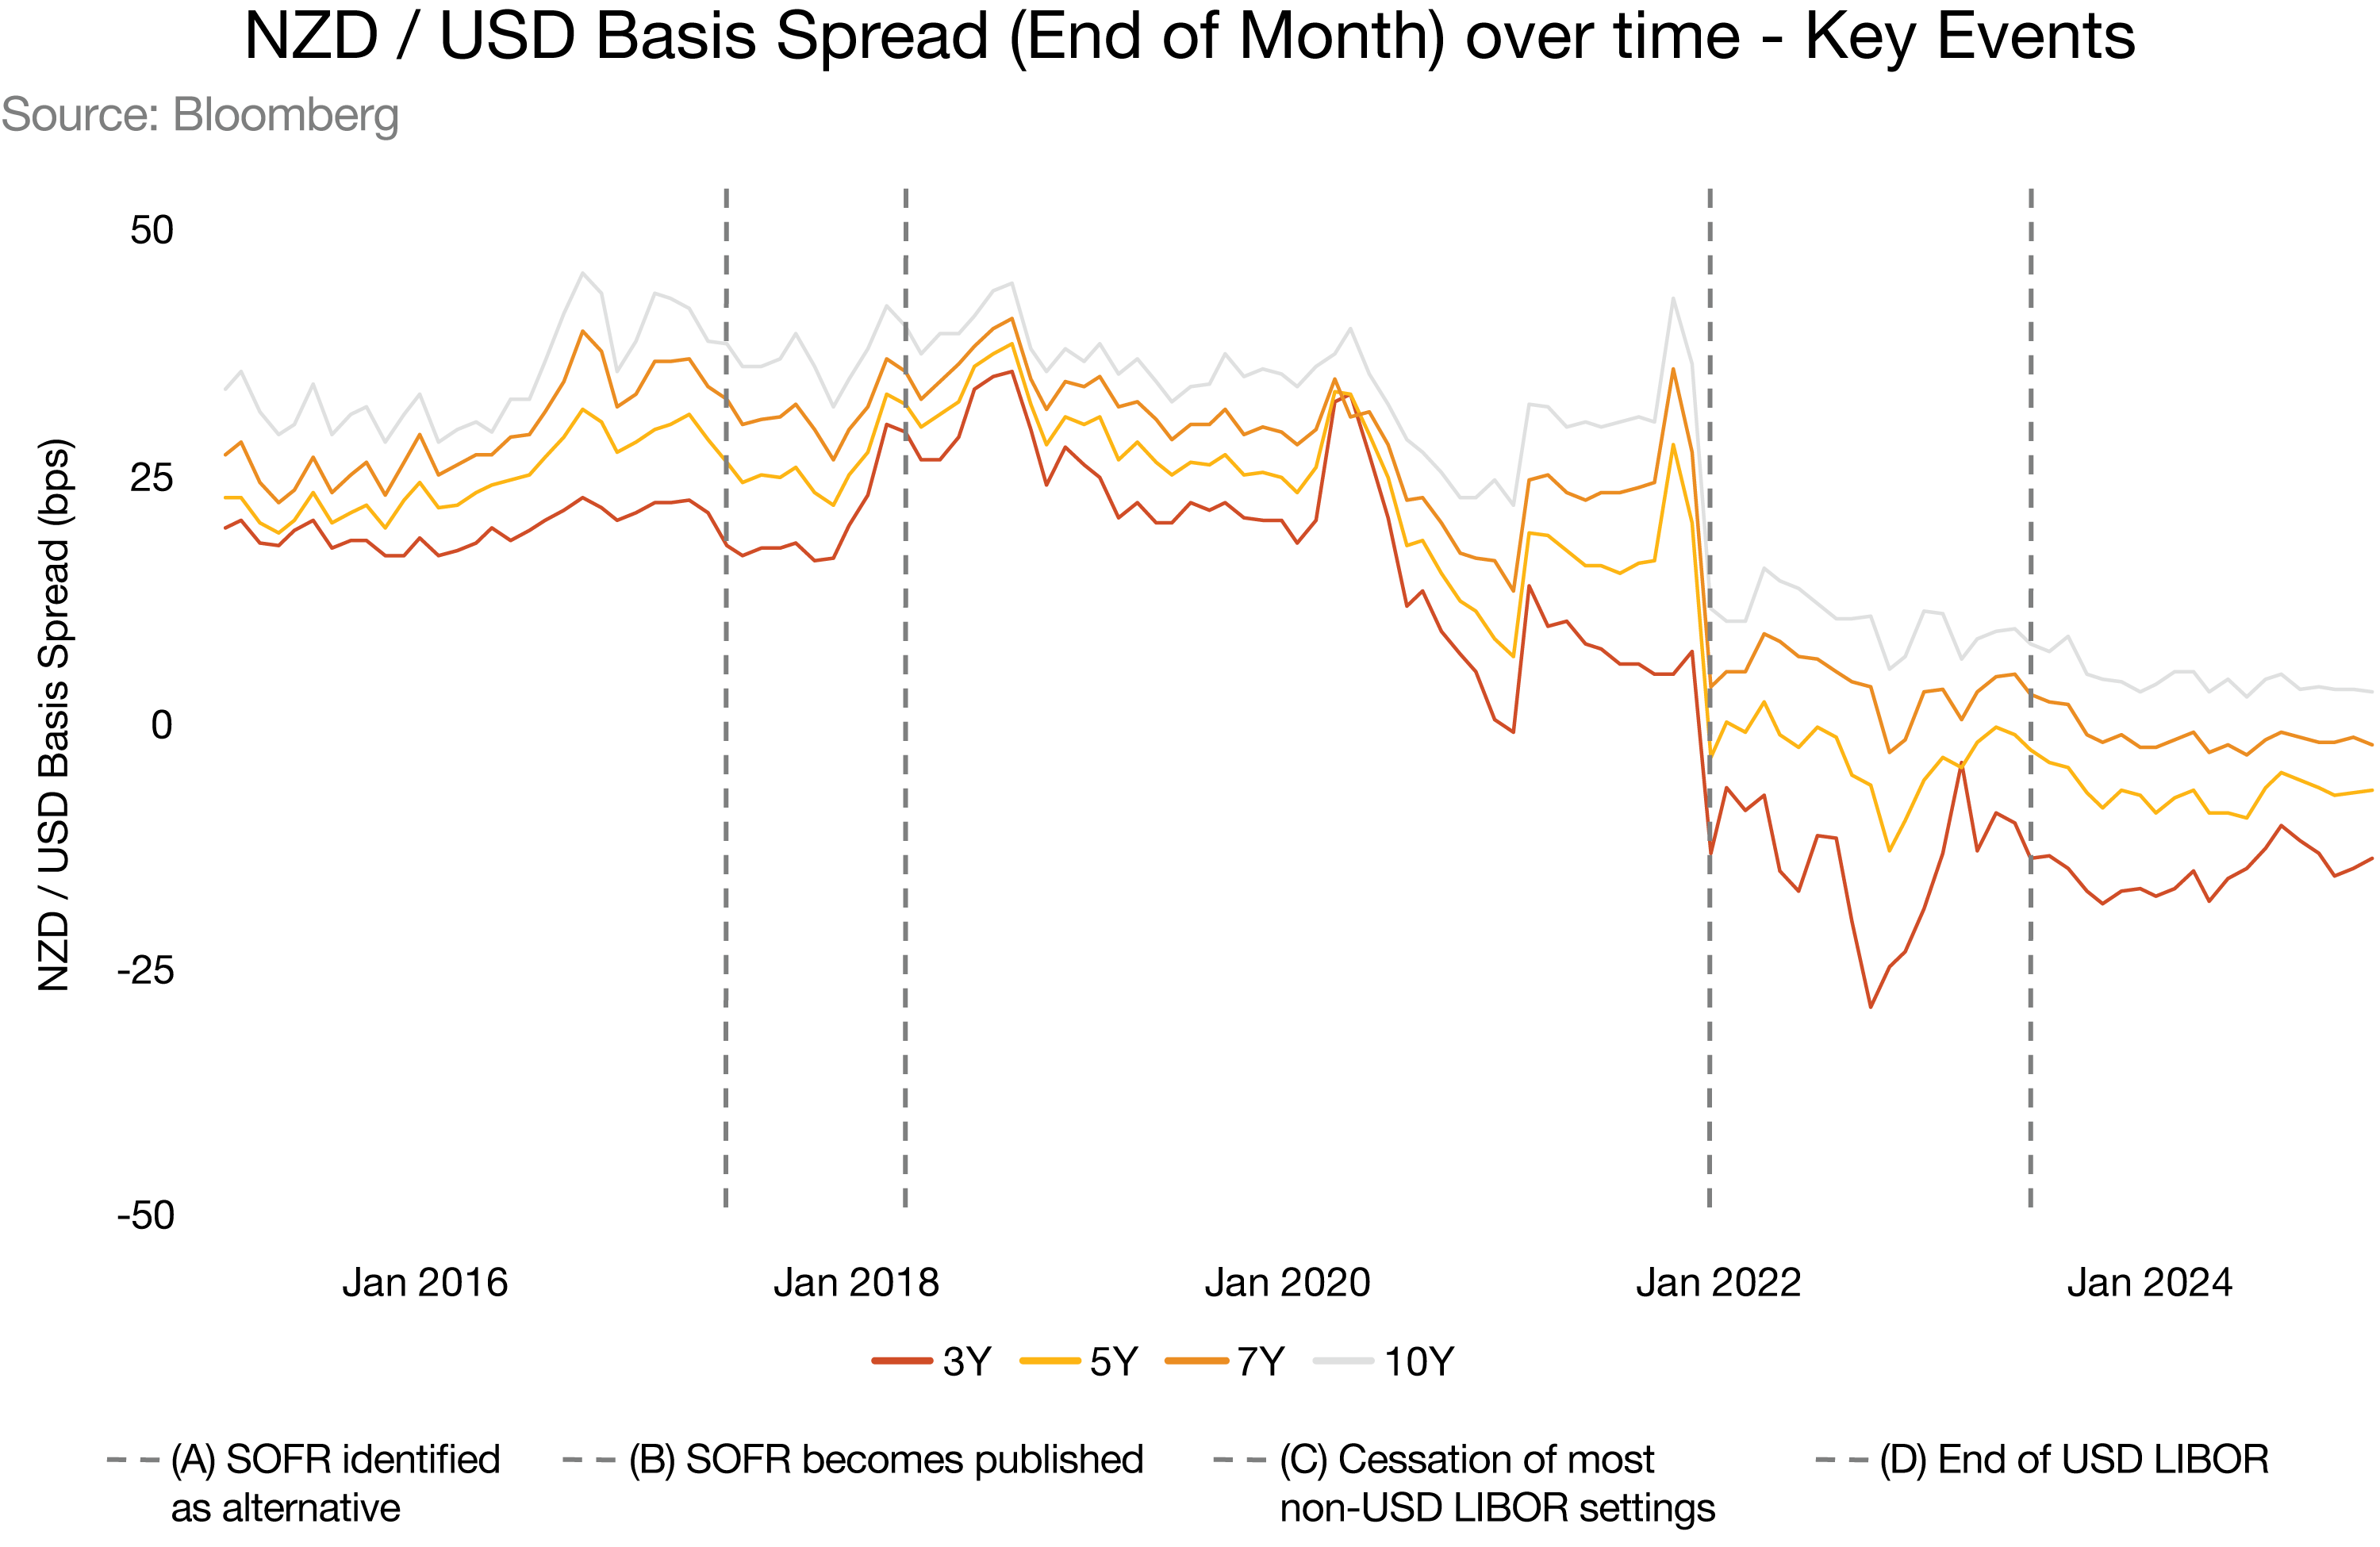
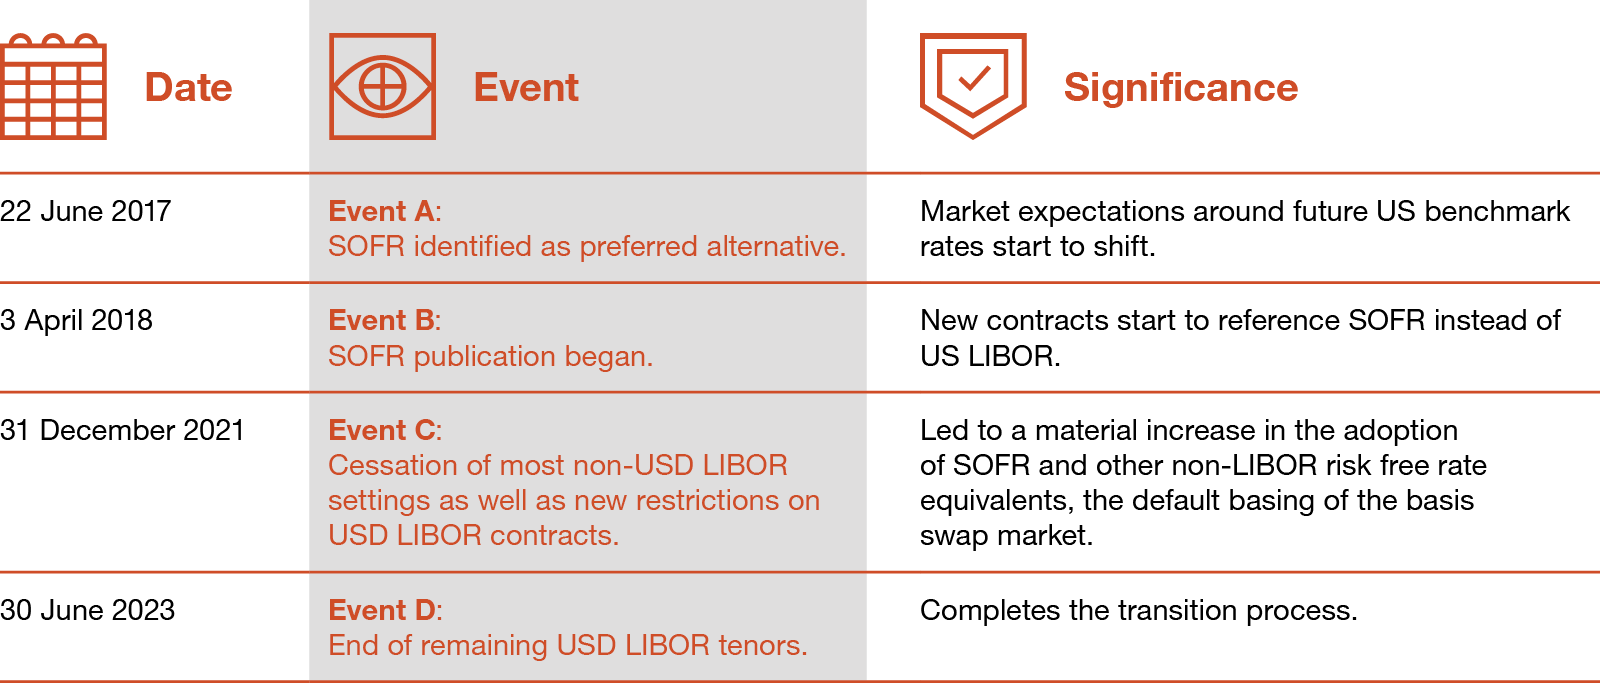
The expected movement in basis swap spreads from a change in the underlying credit risk for US SOFR ultimately did occur once the main market reference was updated. A gradual decline in spreads did occur following Event B, when SOFR starts to be published and declines ahead of the cessation trigger. Although a slow, slight decline does play out following this event, the main trigger is Event C, with the cessation of non-USD LIBOR contracts as well as restrictions on USD LIBOR contracts/derivatives. Following up to and post Event C however, a sharp decline in spreads occurs as the market adjusted to increasing liquidity levels regarding SOFR related contracts/derivatives. This ‘adjustment’ then calms as the transition from US LIBOR to SOFR is finally completed, with spreads (in general) closer to zero than they have been in the past decade. In general, from the time SOFR began being published, to the point where LIBOR was formally discontinued, NZD/USD basis spreads have dropped ~30 bps.
Overall, the transition from LIBOR to SOFR has driven a material move lower in NZD/USD basis swaps. However, other factors such as the level of USD liquidity, the demand for NZD liabilities (or funding) from local banks and, to an extent, the path and predictability of relative monetary policy all arguably have some influence on the daily volatility still observed in basis markets.
For risk managers and New Zealand borrowers, the decline has generally been helpful. However, an increase in interest rate volatility, an inverted swap curve (in NZ and US) and an inversion of US swap-bond spreads (where swap rates are trading below bond yields) have made USD funding less attractive given that investor return expectations (typically set above bond yields) remain elevated and the swapped NZD cost of funding has been less compelling than other markets.
Authored by Sam Duncan
Exploring elevated risk aversion in NZD/USD currency options

The trading of the NZD/USD currency pair often mirrors broader economic sentiments and risk perceptions. During times of heightened uncertainty, such as global financial upheavals or geopolitical tensions, risk assets, including the New Zealand dollar (NZD), often experience increased volatility.
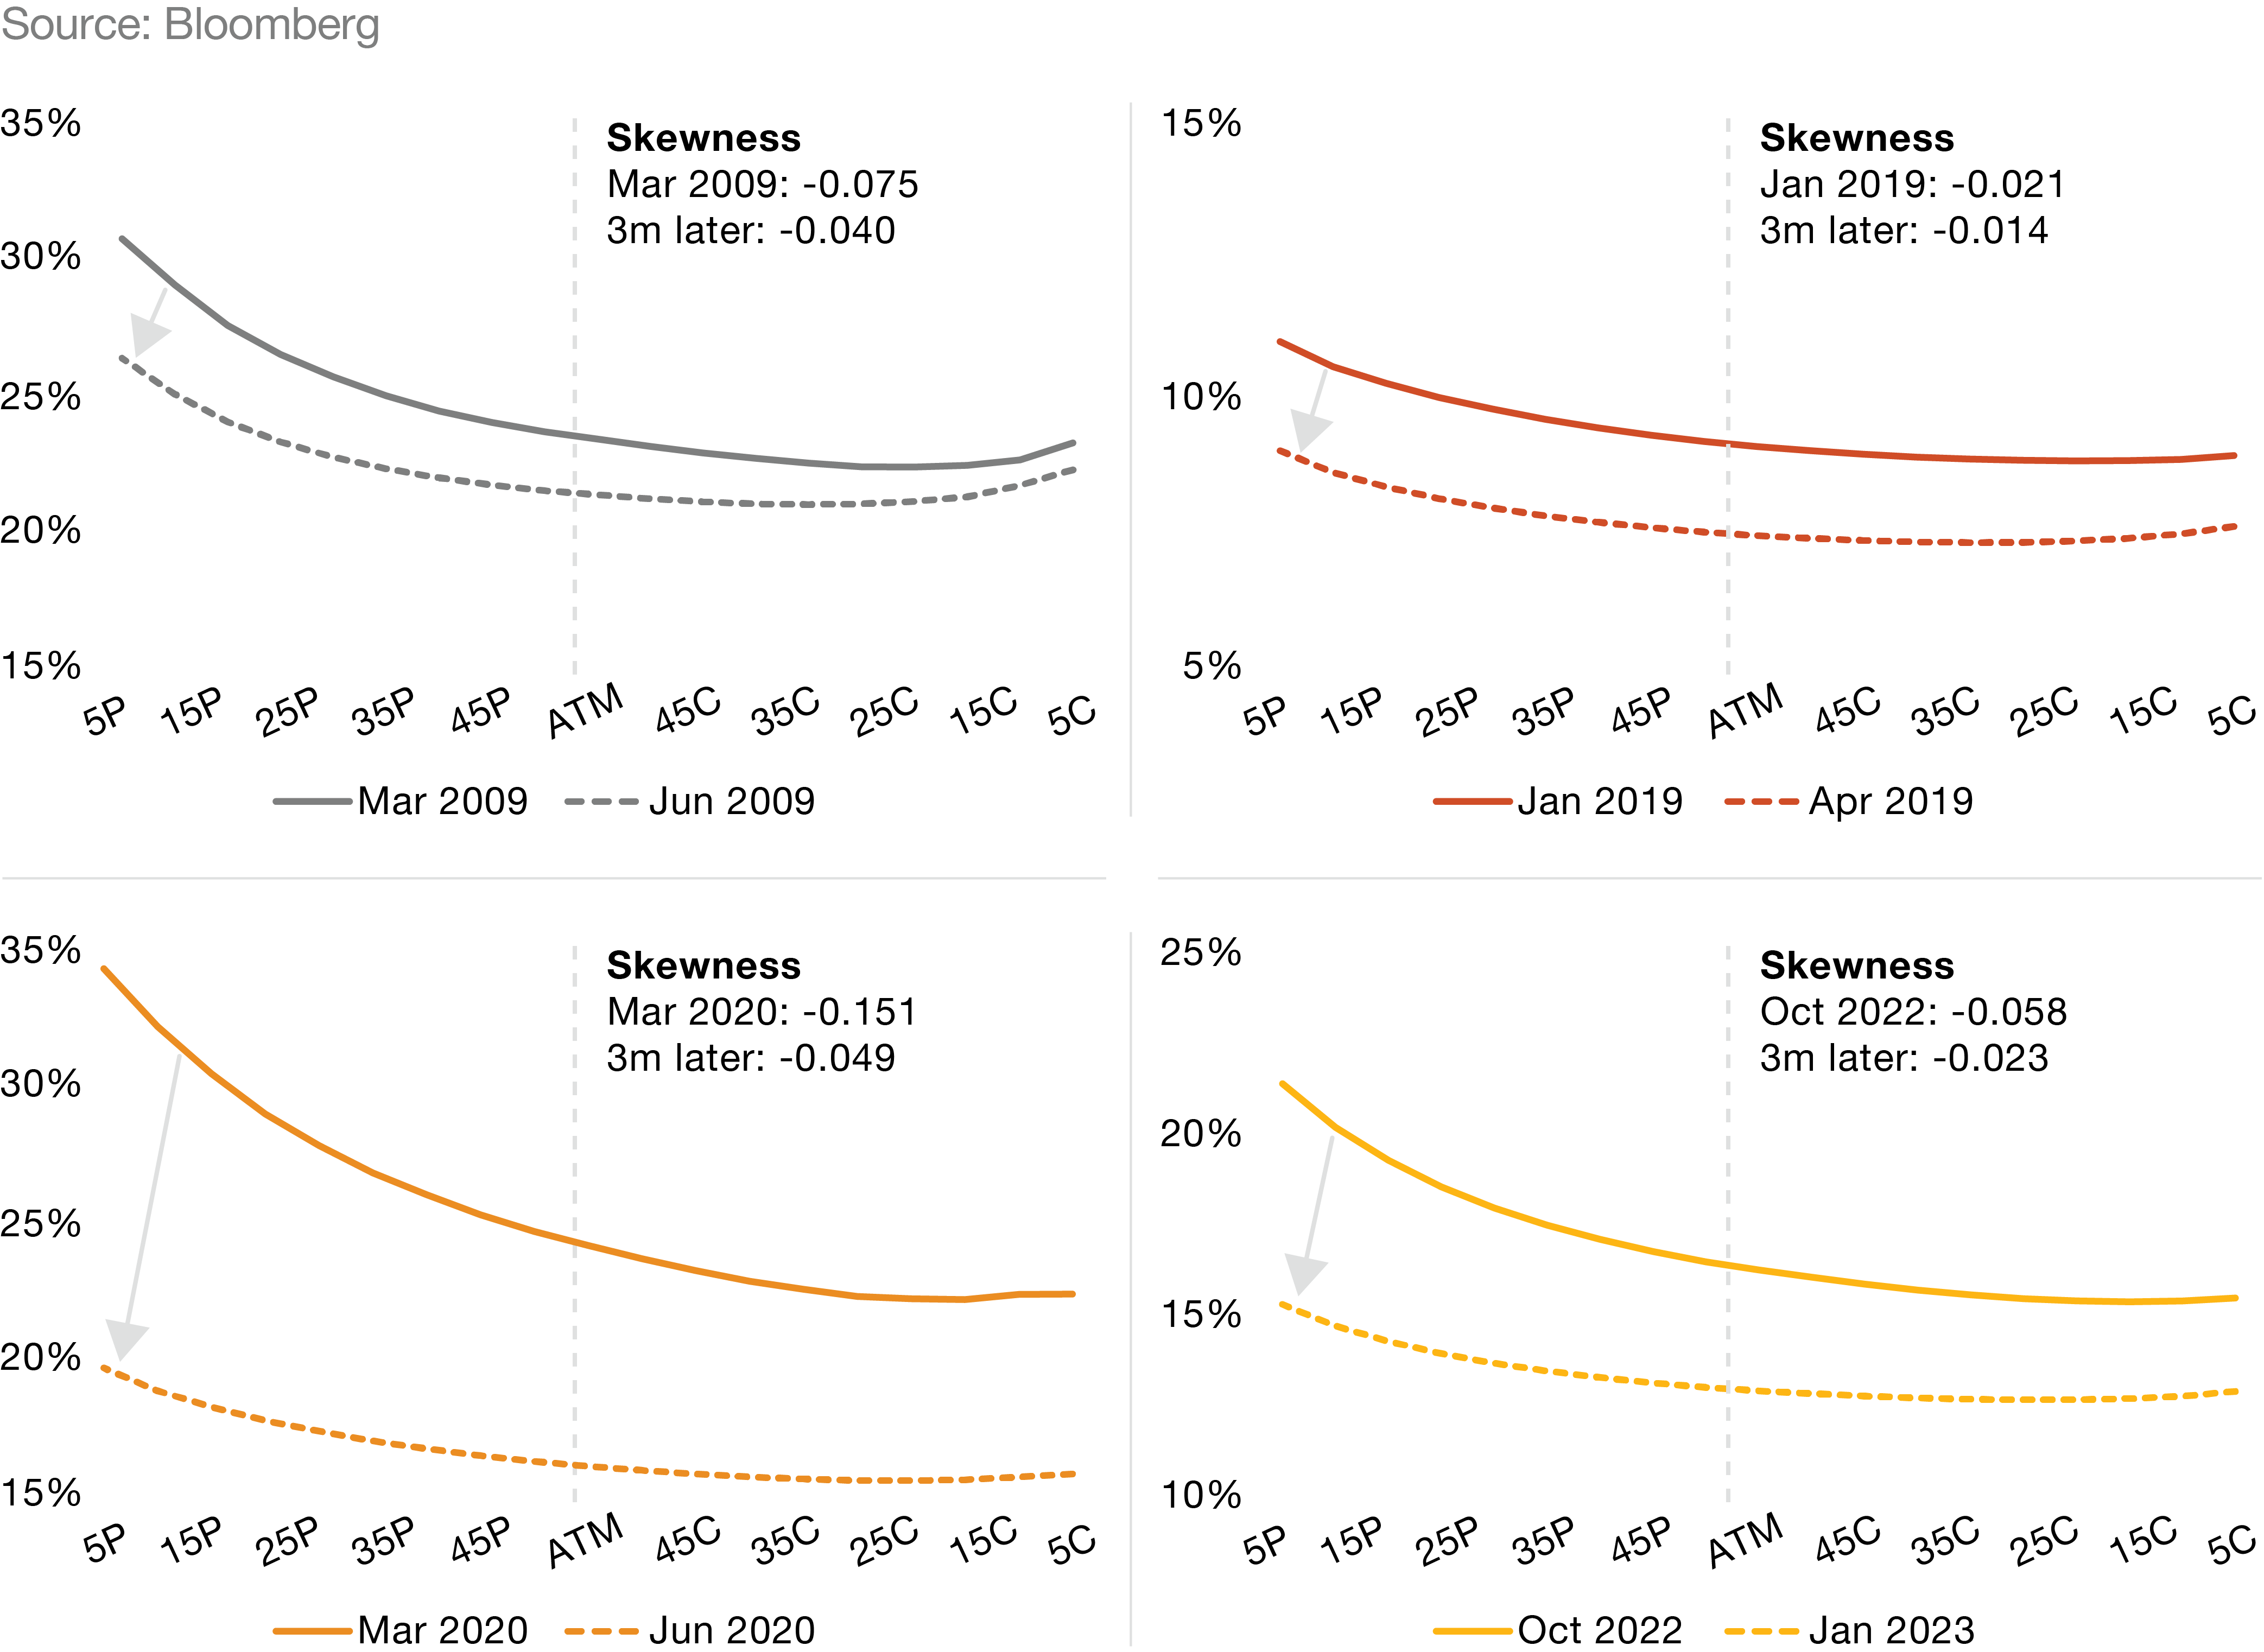
This volatility is evident in the pricing dynamics of currency options, where the cost disparity between calls and puts becomes more pronounced. Specifically, the premium for out-of-the-money (OTM) puts rises relative to OTM calls, resulting in a distinctive volatility "smirk."
This pattern reflects investors' growing risk aversion and the negative skewness observed in near-the-money options. By exploring this trend, this article aims to shed light on the elevated risk aversion in NZD/USD currency options and the implications for risk management strategies, particularly through the use of exporter collars.
NZD/USD options during market volatility:
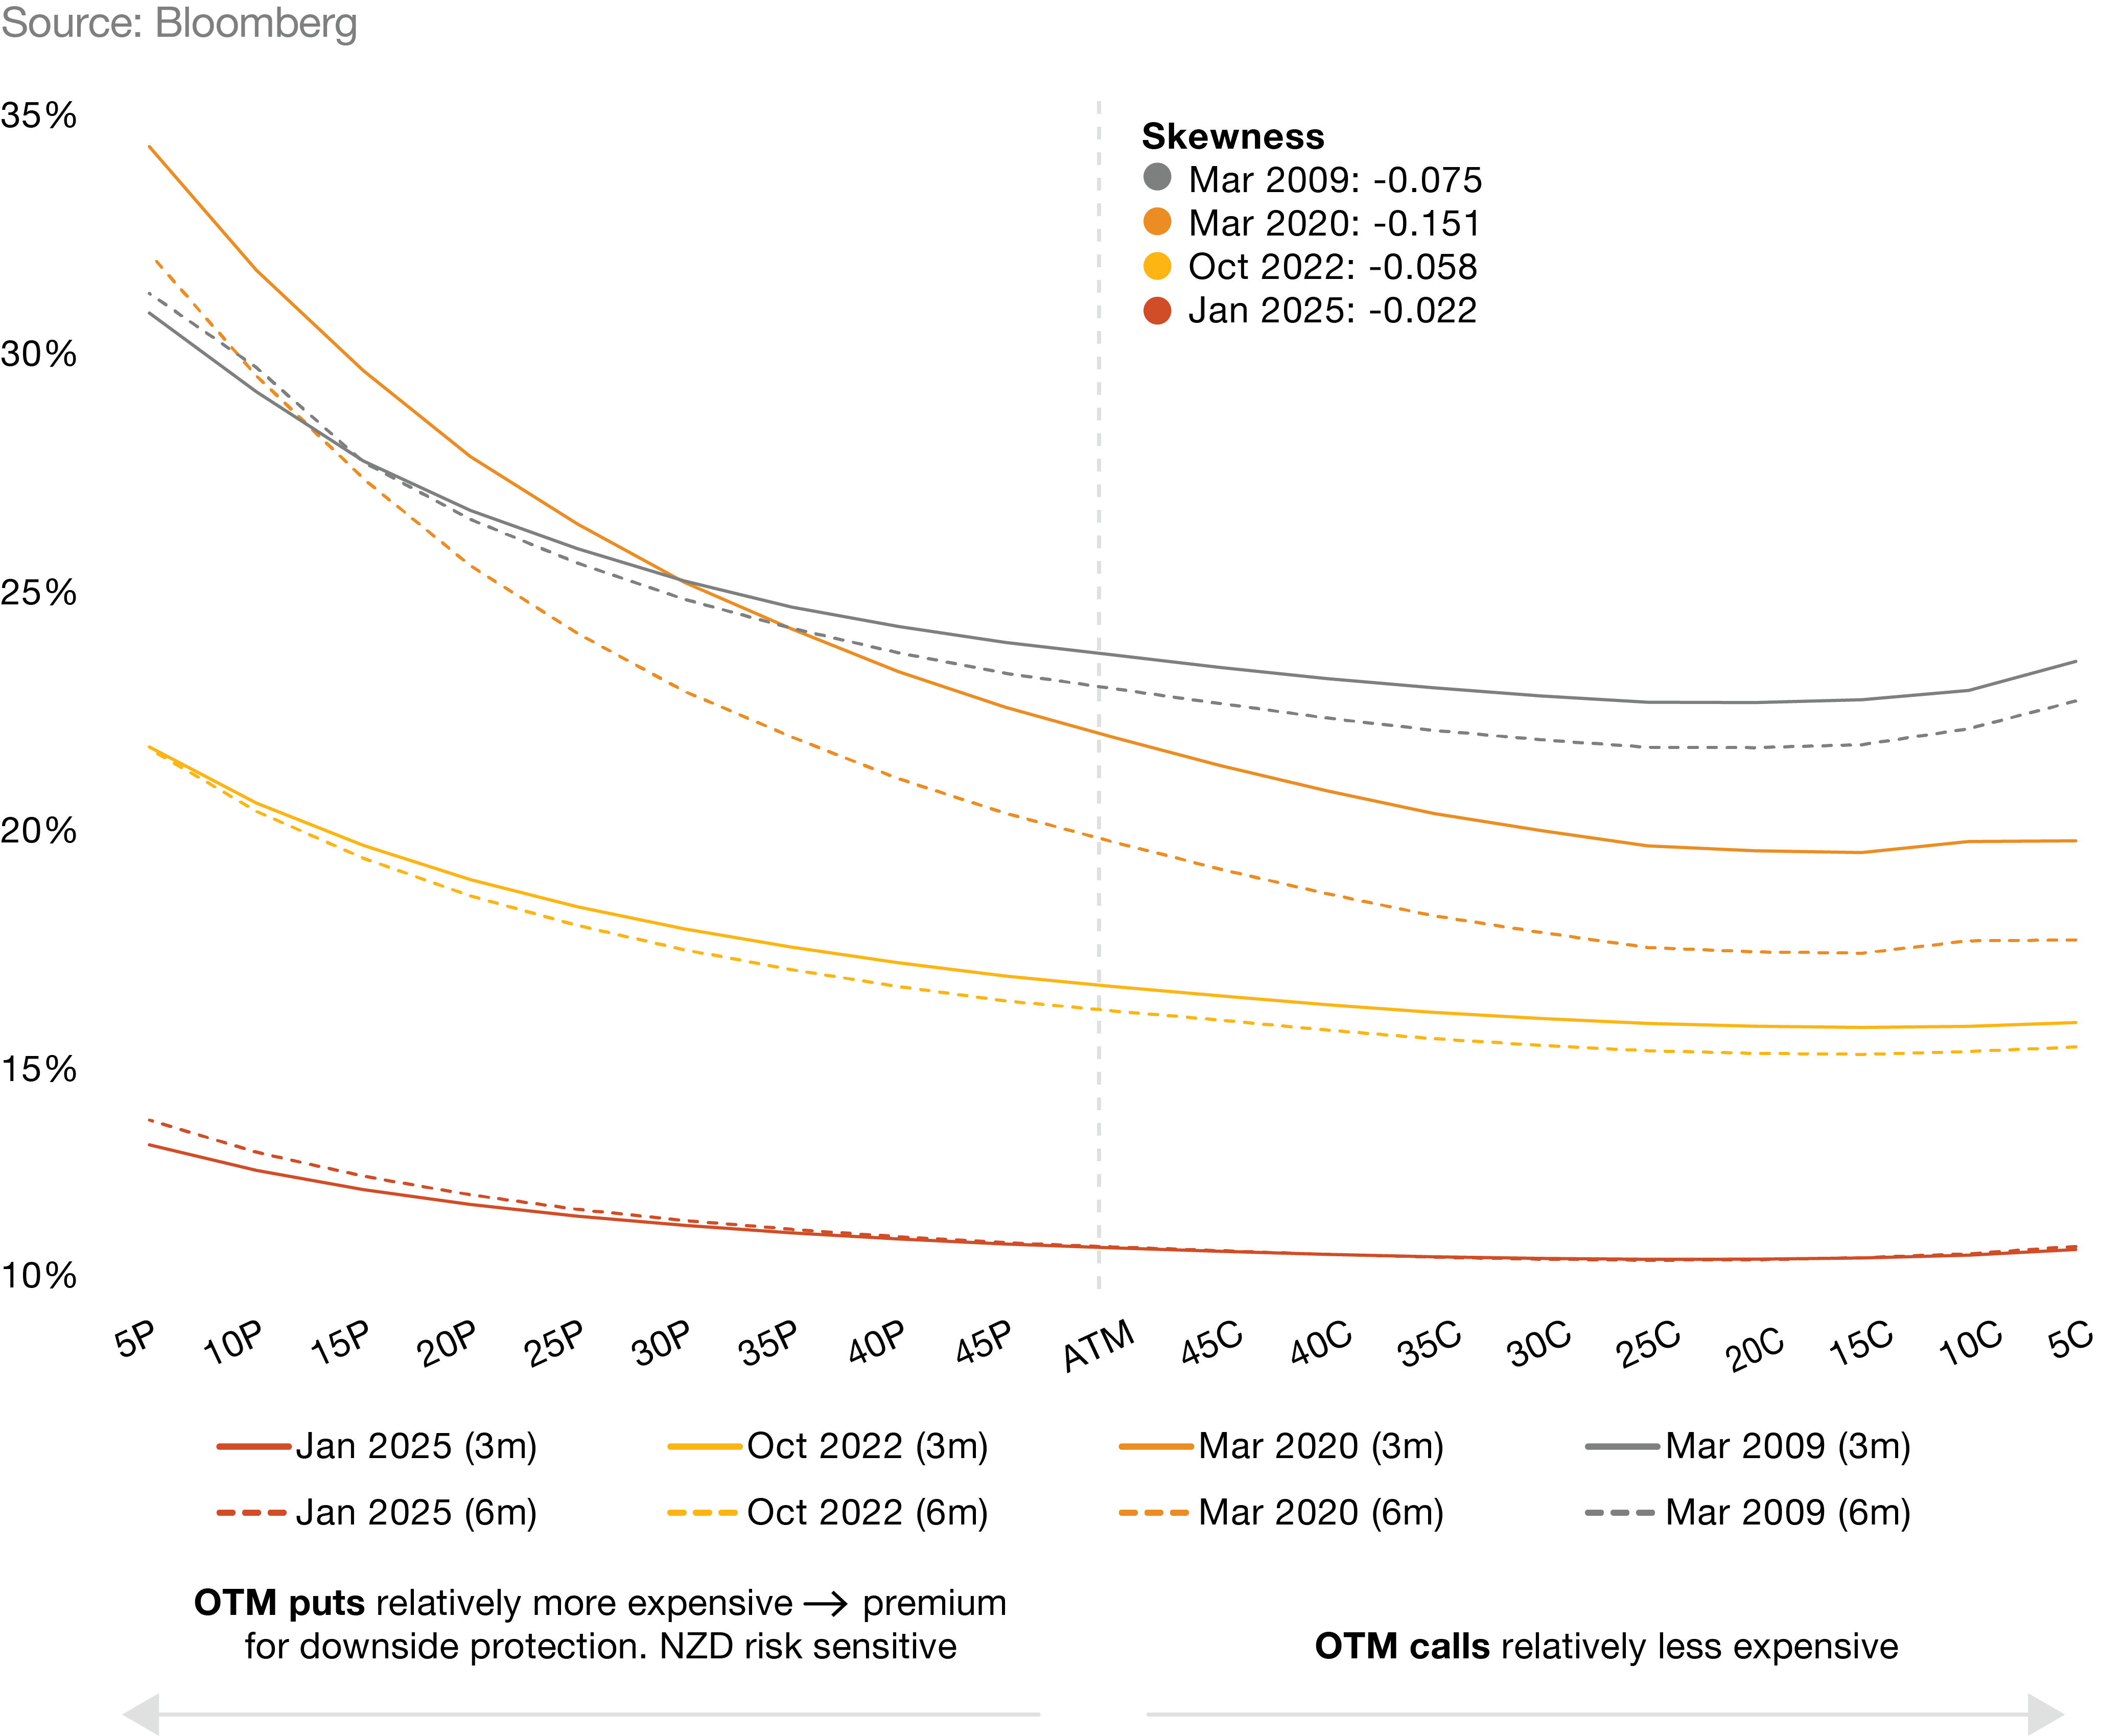
During periods of heightened uncertainty, the volatility of risk assets, including the NZD, elevate. However, the pricing of calls vs. puts shows an increasingly diverging trend → in order to have the right to buy NZD at a future date at a rate lower than the forward price (out-of-the-money), the premium becomes more expensive. This is depicted by the smirked shape of the volatility plots (shown above), where OTM put premiums are higher relative to OTM calls. The slope of this relationship, or skewness, is negative when looking at near-the-money (more liquid) options.
IV curves flatten three months later
Looking at key instances when the NZD/USD exporter filter test becomes active, these volatility curves not only lower (implying less volatility in NZD/USD), but also become less skewed. This means the asymmetric risk-reward of collar options becomes less favourable (the best rate case moves up to a greater extent than the worst case rate).
This shows that during filter activation (heavily suppressed periods in NZD/USD), markets tend to price in even more negativity. As hindsight would suggest, it’s possible to say that markets pushed NZD/USD down too far in the first instance. Instead of viewing NZD as a ‘bargain’, markets become more fearful, offering the opportunity for a prudent risk manager to take advantage of them, especially if they have moved towards maximums of policy on forward FX contracts.
NZD/USD skew during periods of filter test activation vs 3 months after activation:
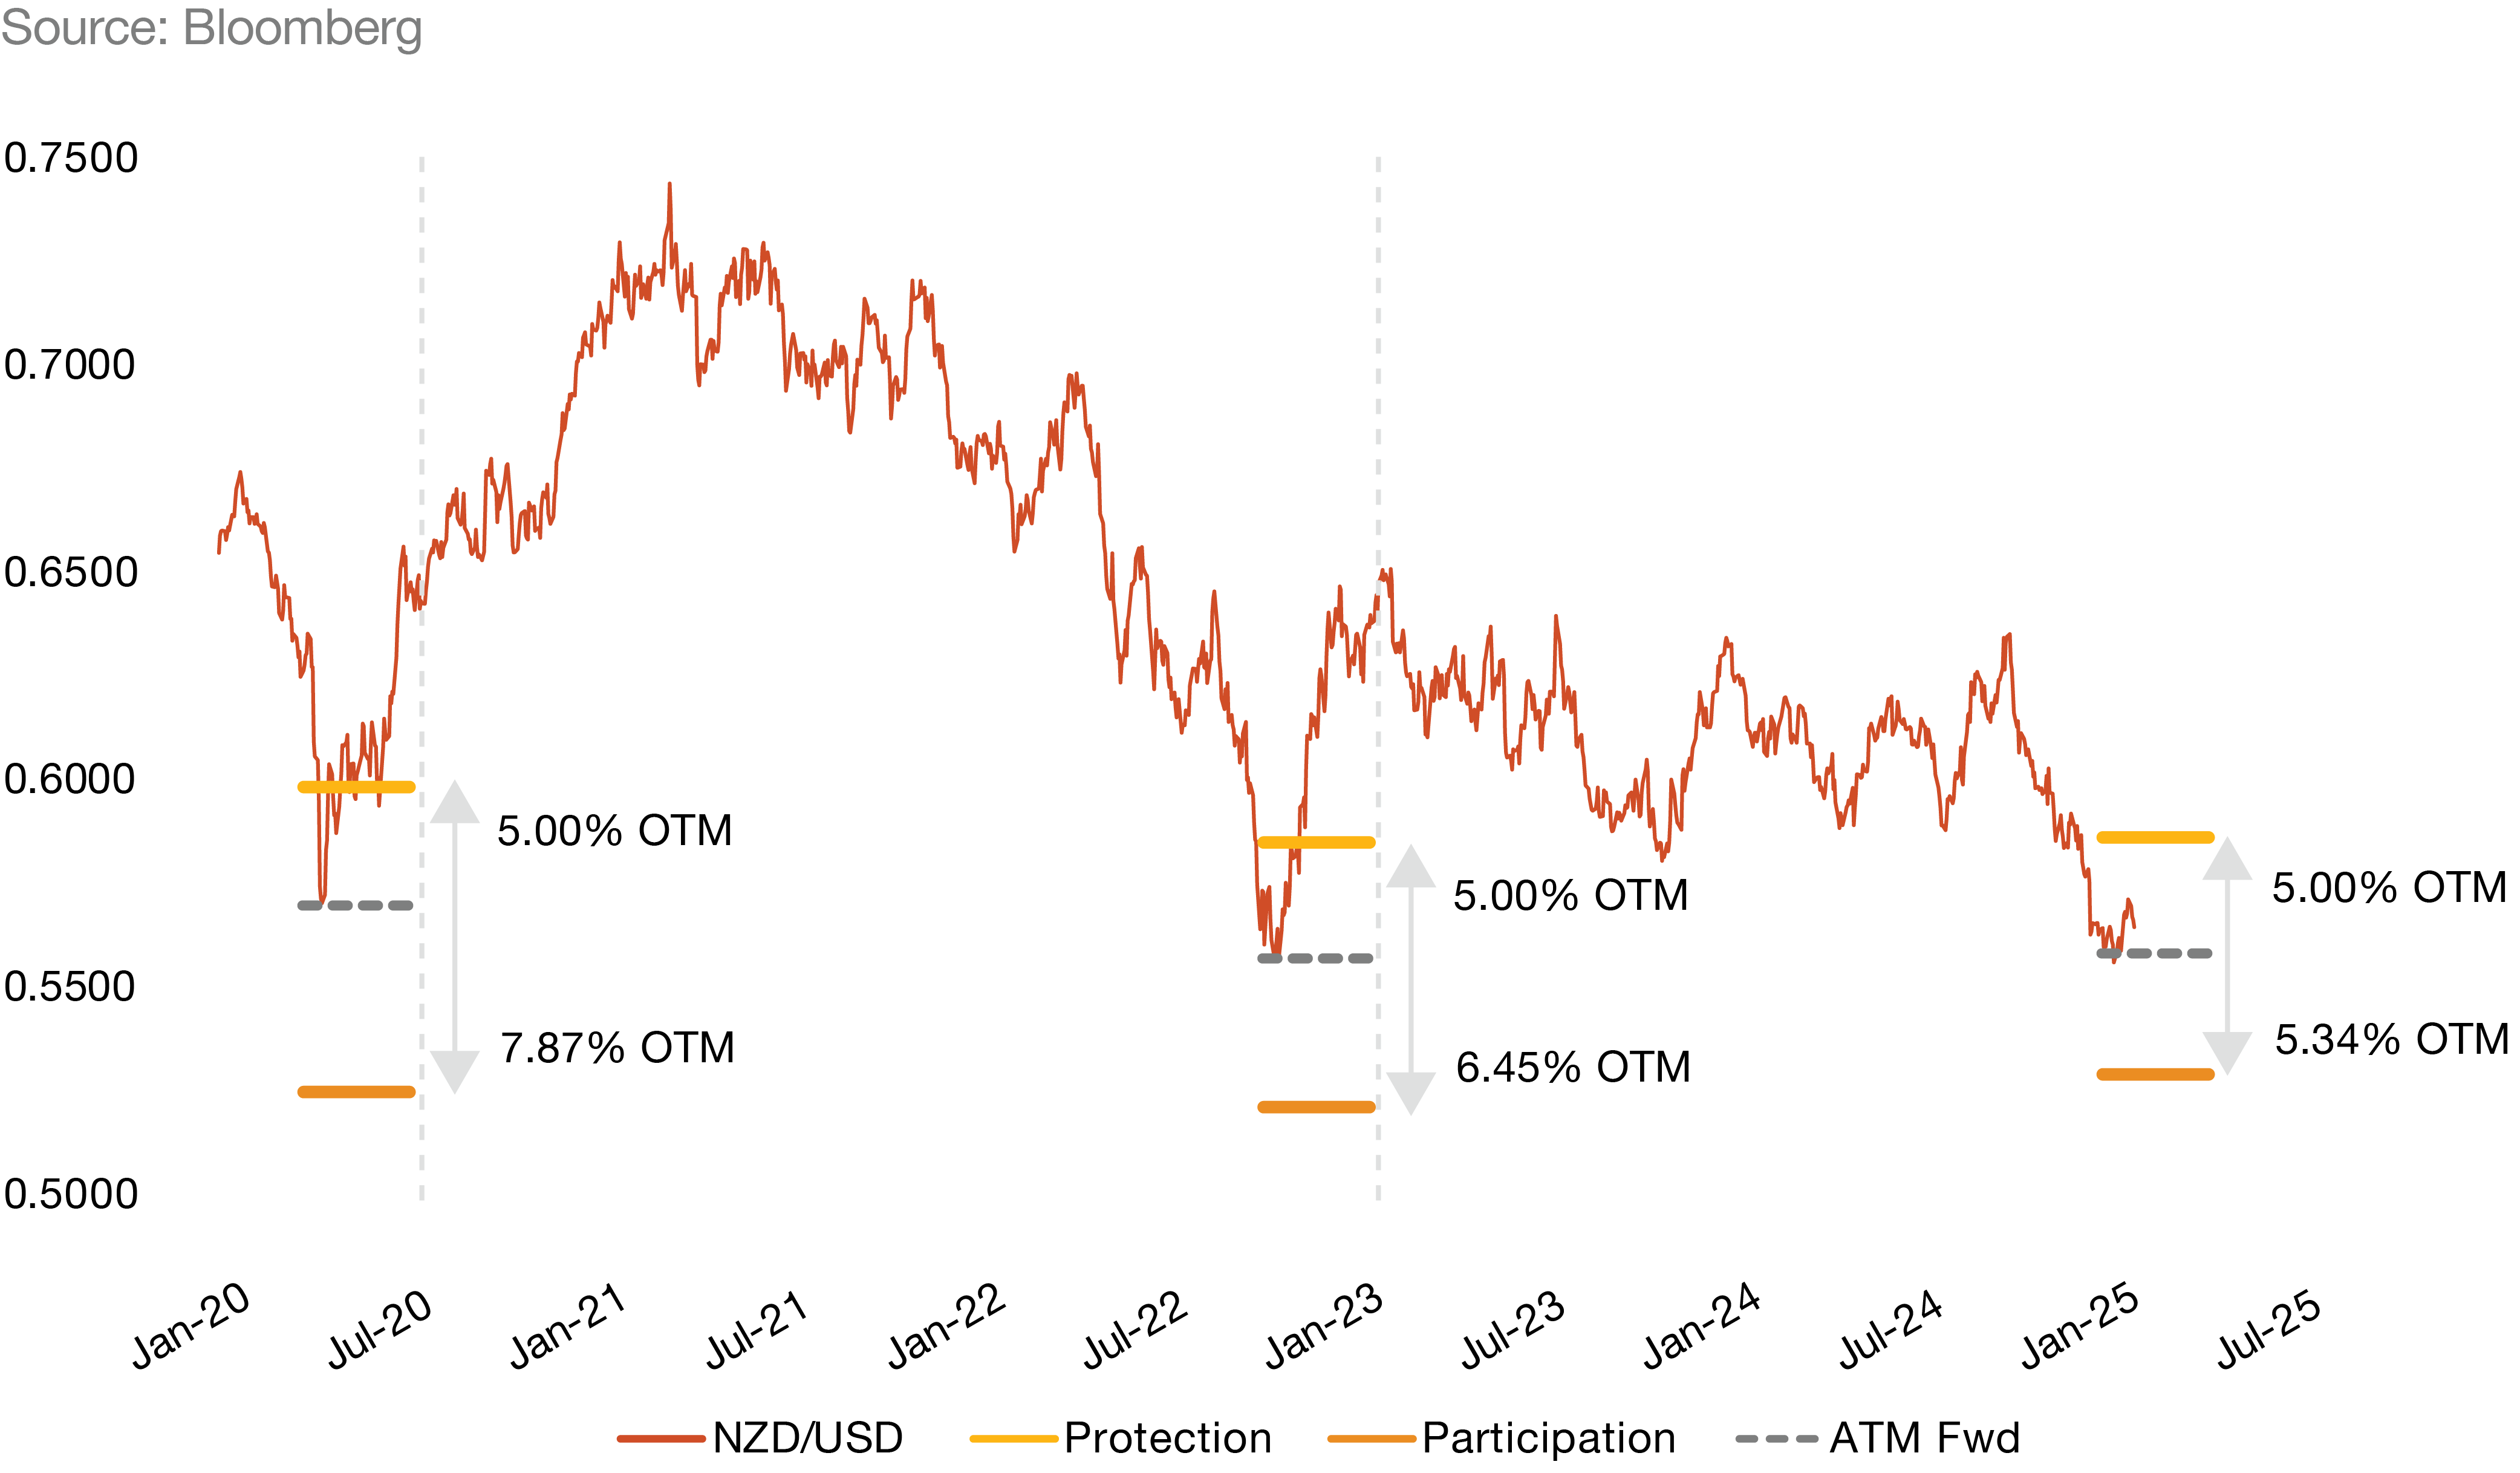
Exporter collars to take advantage of risk asymmetry
- Zero-premium collars offer an asymmetric risk/reward relationship when the seven-year filter test is active.
- Greater uncertainty over longer time horizons causes 6 month collar structures to skew further towards offering a better best-case-rate.
- Across all instances of filter test activation (barring the onset of Covid), NZD/USD traded notably higher than the initial activation rate.
- This suggests option-implied probabilities for the future FX rate are much too skewed to the downside (which often appears valid during periods such as the GFC and Covid, but the key is that pessimism for NZD/USD is often overpriced in such instances.
NZD/USD zero-premium collar during periods of filter test activation:
The analysis of NZD/USD currency options during periods of heightened uncertainty reveals a consistent pattern of increased risk aversion. The volatility curve and negative skewness in option pricing underscore the market's tendency to overprice pessimism, often pushing the NZD/USD rates lower than warranted.
However, this environment also presents unique opportunities for savvy risk managers. By leveraging zero-premium collars, particularly when the seven-year exporter filter test is active, investors can take advantage of asymmetric risk-reward dynamics.
Historical instances demonstrate that NZD/USD tends to recover and trade higher than initial activation rates, suggesting that the market's bearish outlook is frequently overstated. Understanding and navigating these trends can provide strategic advantages in managing currency exposure and optimising risk-return profiles.
Authored by Ben Bridgman
What’s the right size for a treasury team?

The short answer is, there is no one size fits all solution. Steve Jobs once said, “Great things in business are never done by one person. They’re done by a team of people.” This sentiment holds especially true in the realm of treasury management, where collaboration and the segregation of duties are critical to maintaining integrity and efficiency.
The size and importance of the treasury team depends on a number of factors, such as the size of the organisation, nature of the business, complexity of financial transactions and the capabilities of those responsible for financial management.
Streamlining treasury teams to effectively handle all essential tasks involves looking at the business, the technology, processes, and team skills.
Segregation of duties ensures that no single employee can both commit and conceal errors or fraud, whether intentional or accidental. This principle is upheld by involving multiple individuals and systems throughout the transaction lifecycle. In larger treasuries, this is traditionally achieved through the division into front, middle, and back offices.
Roles and responsibilities in treasury
The front office is responsible for managing the treasury related risks of the business within the board approved treasury policy parameters. Key tasks include working with the business to identify risks within the organisation (i.e. interest rate risk, foreign exchange risk etc), developing hedging and investment strategies and executing trades.
The back office administers and supports the front office and its main functions are to validate, settle and account for deals. Some of the key responsibilities include ensuring that deals have been accurately recorded by the front office, ensuring the deals are inline with policies and guidelines and ensuring the deals have been confirmed by counterparties. The back office manages the deal’s life cycle through to maturity.
The middle office acts as a bridge, concentrating on risk management and compliance, ensuring that transactions adhere to internal policies and regulations. The middle office provides regular treasury reporting to management.
This segregation of duties ensures the integrity and efficiency of financial operations, minimising errors and fraud by distributing responsibilities across different personnel. The split of front office and back office tasks ensures that the person accounting for the deal isn’t the person who is executing the deal and vice versa. Thereby reducing the risk of error or fraud. A typical treasury transaction process is outlined below:
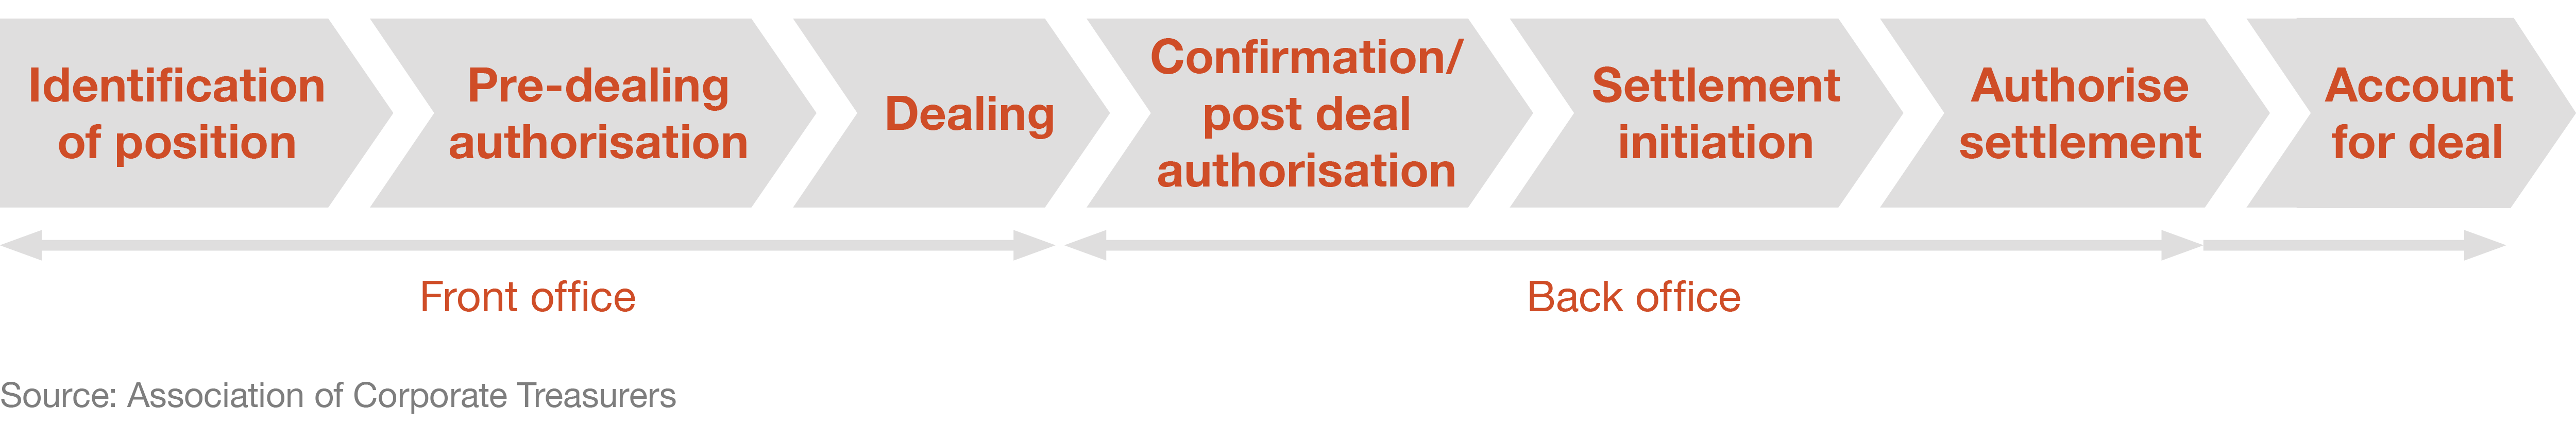
However, not all treasuries have the luxury of a full three-office structure due to the size of the team. Particularly in small or medium sized enterprises (SMEs) the size of the treasury team is often quite small. This makes the segregation of the front, middle and back office tasks difficult. In these cases, it is still important to ensure there is some segregation between the transacting of deals and the confirmation and accounting of them. This will reduce the risk of error or fraud in the business.
When considering the size of the team, it is important to think through scenarios such as what if key personnel are away? Are there back-up personnel who have the capability to perform the role? And how will segregation of the front and back office tasks be maintained?
The evolving role of technology
The COVID-19 pandemic and other geopolitical events have highlighted the importance of robust risk management and forecasting capabilities. Post a period of high inflation and now with continuing volatility in interest rates, treasury teams must adapt their risk management strategies.
Technology is a vital enabler for treasury teams, helping them manage complexity, enhance operational efficiency, and contribute more effectively to the business’ strategic goals.
Technology is playing a transformative role, with treasurers needing advanced skills to leverage data and automation. Modern treasury management systems (TMS) automate processes and create workflows that clearly delineate responsibilities between different roles. Role-based access ensures that front-office staff, who are responsible for trading and deal execution, have different permissions compared to middle office staff, who handle risk management and compliance and back office operations, who are responsible for settlement and accounting.
Having an audit trail that records every transaction and change made within the system will make it easy to identify and discrepancies and errors are quickly identified and addressed.
Real-time data and reporting help middle office teams monitor the front office activities and ensure compliance with risk management policies. These tools provide insights into transactions executed, exposure forecasts and compliance with the treasury policy parameters. Many businesses will use either a TMS or a treasury reporting system such as PwC Treasury Intelligence to monitor and manage their financial risks.
There's no “One Size Fits All” for a treasury team, and the ideal setup depends on the business size, complexity, risks, and strategic priorities. It is important to have a right-sized team which is capable of managing risk effectively while maintaining segregation of duties. Adopting technology may also assist in improving the integrity, efficiency and accuracy of treasury processes and reporting.
Authored by Rajeev Verma


