


Leveraging the best climate projections and data for scenario analysis: The role of downscaling

Today climate reporting is no longer a choice for many organisations in Aotearoa New Zealand but a mandatory requirement. With the launch of the Aotearoa New Zealand Climate Standards, companies need to understand both the current and foreseeable impacts of climate-related risks and opportunities, while developing corresponding strategies for effective management.
Scenario analysis is an important input into this process and a requirement of the climate disclosures themselves. Rather than attempting to predict the future, scenarios craft plausible narratives of potential futures spanning a broad spectrum of risk. These narratives project a variety of risks - both physical (chronic and acute) and transitional (resulting from the shift to a low-emissions economy) - and how they interplay. This approach enables organisations to consider a range of potential climate changes, assess their impact on the business, and adapt to or mitigate these risks.
How do we assess physical climate risks?
Undertaking a comprehensive assessment of physical risks means we need to better understand the possible trajectories of our climate system, and that requires using the results from Global Climate Model (GCM) simulations. The Carbon Brief provides an excellent overview about how these models work. They are driven by a number of common scenarios used widely across the scientific community, and enable organisations to use different models to assess the climate impacts of greenhouse gas emissions. The Intergovernmental Panel on Climate Change (IPCC) reports on the results of using the Representative Concentration Pathways (RCPs) and Shared Socioeconomic Pathways (SSPs). These scenarios are used in many global climate models. They report on a multitude of different climate measurements, and span a wide range of temperature outcomes, from under 1.5°C of warming to over 5°C by 2100.
So while there is a wealth of data to use when assessing physical climate risks, there is a challenge: These GCMs simulate the weather every few hours, for the entire earth, for hundreds of years, under many scenarios. They require considerable computer resources to run, and so compromises have to be made. Often, it is in the form of lower spatial resolution (which results in larger pixel size), meaning image detail is less accurate. Each grid cell in a relatively detailed GCM spans around 100 km by 100 km. As an illustration, this is how Aotearoa New Zealand’s topography is represented at that scale.
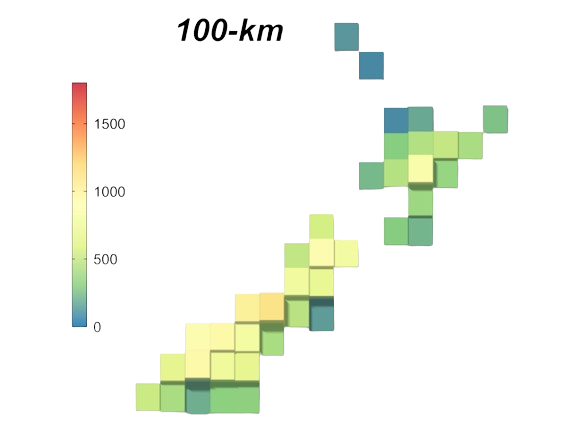
Source: Dr. Peter Gibson, the National Institute of Water and Atmospheric Research (NIWA)
Because of this limitation, GCMs fail to accurately represent local nuances, like the intricate interactions between regional air circulation and topography — crucial for a small island nation like Aotearoa New Zealand. To address this, we need to downscale the GCM outputs.
How does downscaling work?
Downscaling is about turning the low-resolution outputs from a GCM into a high-resolution picture of the regional climate. There are two main approaches: statistical and dynamical which will be examined separately.
Statistical downscaling is where scientists use data from the past to establish a relationship between the global picture and the on-the-ground weather. For example, when the corresponding grid cell has a temperature of 15°C, we might find that it tends to be 14°C in Wellington and 16°C nearby in Nelson. The real relationship will be much more complex, taking into account details across a number of factors: the distributions of the modelled and observed data (important for extreme events); what the neighbouring grid cells are doing; what happened recently; what is the direction of the air pressure and the prevailing wind, and much more. Scientists use proven techniques to navigate this complexity and build robust statistical models.
One novel approach is to use Machine Learning (ML), a type of artificial intelligence (AI), to help establish the statistical relationship between the low-resolution model data and the local conditions. ML tools can improve the accuracy of statistical downscaling by finding hidden links between data. However, they need to be applied with caution and verified with expert judgement, as they are often “black box” solutions that do not show their working.
Dynamical downscaling is where we use the GCM outputs and feed them into a high-resolution regional climate model, where each grid cell influences its neighbours. In a global climate model, the grid cells wrap around the globe, so there is no edge. A widely used type of regional climate model is called a “Limited Area Model”. This covers only a limited regional domain, but as it has edges, we need to tell it what is happening and define the boundary conditions.
The GCM results are used to provide the boundary conditions, and the regional climate model does the work of simulating the climate within its domain at high resolution. Experts then analyse the results and apply corrections to account for any biases that the models may have introduced. This approach is powerful as it is much better than a GCM at resolving synoptic-scale processes like storms that have a big influence on the kind of extreme weather events we are concerned with today. The flooding events in Auckland and Hawke’s Bay in 2023 have highlighted the importance of getting these processes right.
Where can I find downscaled data to use?
There is widespread demand for data from downscaled GCM outputs, and a number of options to choose from. Downscaled climate simulations for the entire globe are available from a few providers, including freely available data from organisations like NASA at a resolution of around 30 km. Here in Aotearoa New Zealand, The National Institute for Water and Atmospheric research (NIWA) has been tasked with providing downscaled climate data to the public. This has already been completed for four of the RCPs (the scenarios used in the IPCC’s 2013 Fifth Assessment Report), and downscaling of three of the SSPs (the scenarios used in the IPCC’s 2021 Sixth Assessment Report) is now underway. As part of the MBIE-funded downscaling project run by NIWA, some of the outputs will be made freely available. NIWA is also using AI to enhance its statistical downscaling approaches in a related project.
For dynamical downscaling, NIWA is now using the Conformal Cubic Atmospheric Model (CCAM). This uses a technique where the grid spacing is variable - illustrated in the figure below.
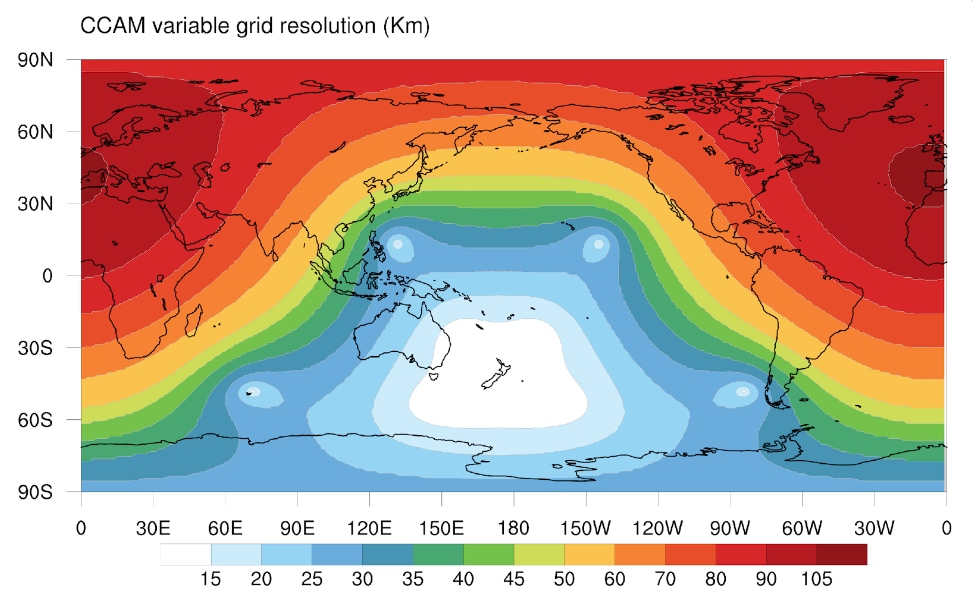
Source: Dr. Peter Gibson: NIWA, 2023
The white and blue here indicate higher resolution, and this relatively high level over the wider South Pacific allows better resolution of storms (e.g. atmospheric rivers, tropical cyclones) before they enter the Aotearoa New Zealand domain. Over the country itself, the resolution gets as high as 12 km for each grid cell. Compared to a GCM, you can see how much more accurate the local topography appears.

Representation of Aotearoa New Zealand elevation / topography in the CCAM model used by NIWA for dynamical downscaling. Courtesy of Dr. Peter Gibson: NIWA, 2023
There are also private providers, both international and local, that can provide high-resolution, downscaled climate data as a service. These may be a good fit for your business, particularly if you need to understand climate variables that are not publicly available. But understanding providers’ credentials and the appropriateness of their data for your situation requires some expert judgement. Remember, there is a difference between precision and accuracy.
When it comes to addressing climate change, organisations often grapple with the considerable challenge of navigating a wealth of information. It can be overwhelming to sift through and identify the most reliable, relevant data. Our team of climate experts at PwC is here to help. We specialise in applying downscaled climate projections to climate-related disclosures, understanding the strengths and weaknesses of various data sources. By partnering with us, you can gain valuable insights into key risks without getting lost in unnecessary details. We can support you in making informed, and strategic decisions amid the complexities of climate-related uncertainties.
Visit our Sustainability, Climate and Nature page for more information on how we help businesses to create a sustainable, environmentally responsible, low carbon future.
Contact us
Hunter Douglas
Climate Scientist & Manager, Sustainability, Climate & Nature, Wellington, PwC New Zealand
+64 27 336 2557


